Utilities industry

Where the interruptionpays for the miss

Circuits already serve load. Outages and switching show up after the event has started. Substation and feeder assets fail before the crew is staged. The utility still has to restore.

  • 01

    High-risk transformers found in the test history, not after the failure

    Predict health index from oil, DGA and paper-condition data the utility already collects, with class rebalancing so Poor and Very Poor units are not buried under overall accuracy.

  • 02

    Inspections aimed at the accounts consumption data already points to

    Rank likely theft and non-technical loss from metering history and confirmed inspection outcomes, so field effort follows pattern rather than chance.

  • 03

    NIS2 obligations mapped before the reporting clock starts

    Structure applicable cybersecurity requirements, documentation gaps and incident-reporting workflows from regulatory text and existing compliance records — for human review, not as a legal determination.

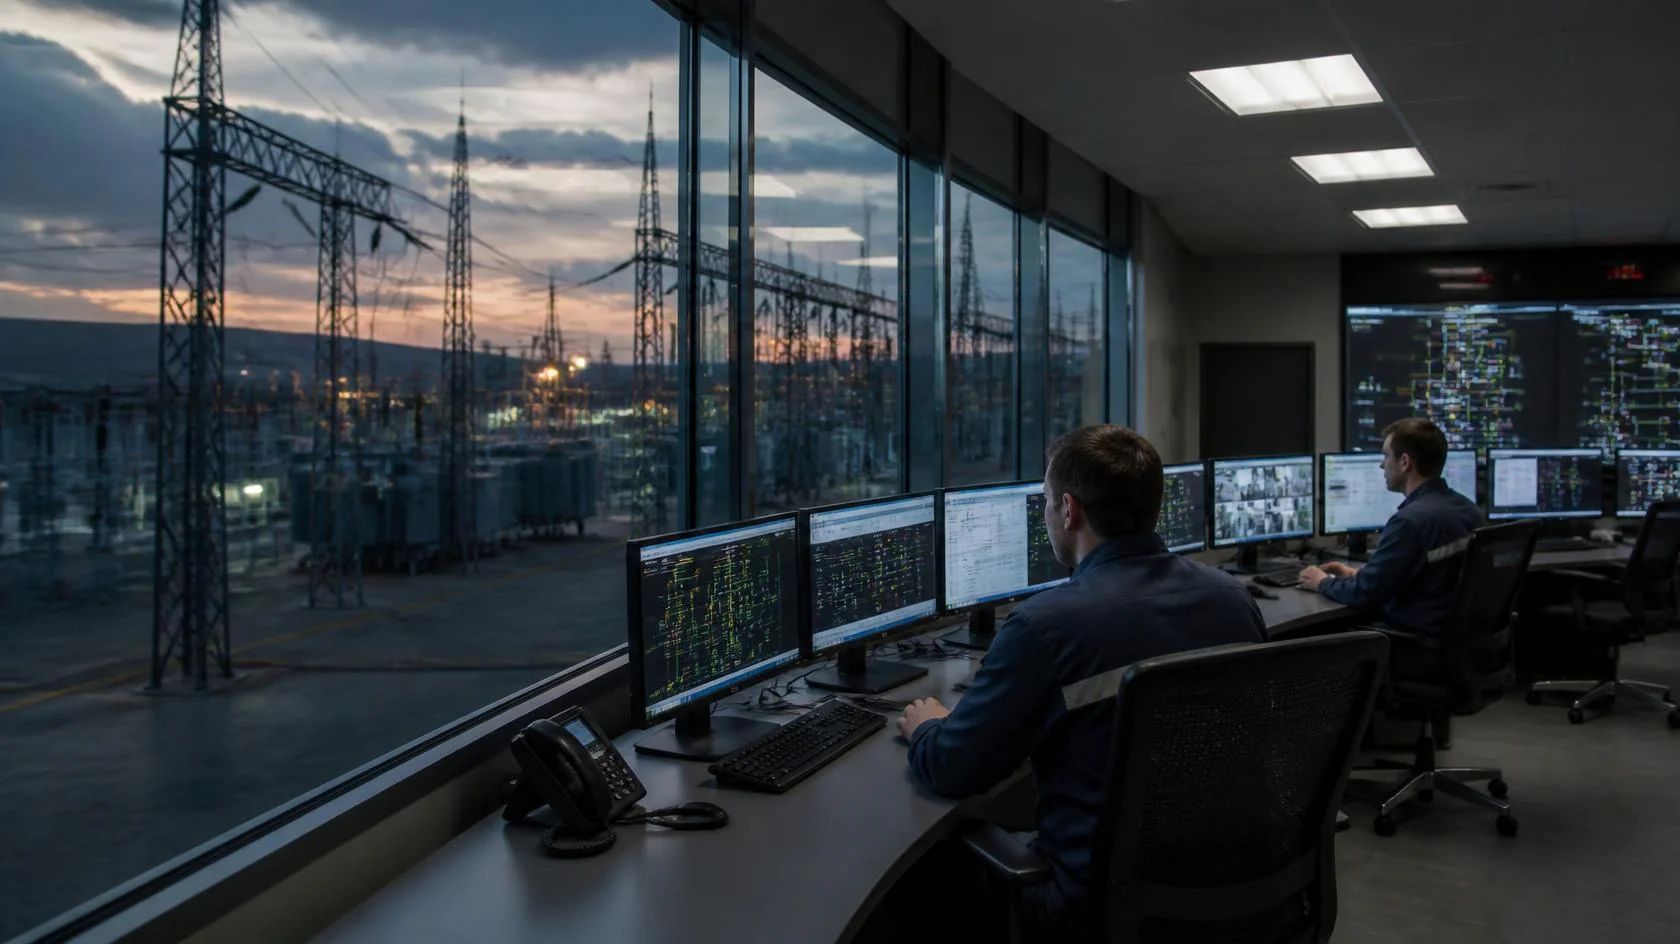
In the control room and in the field

The margin is decided during the outage

Utility operators lose time and money in three places that rarely share one screen: a switching sequence that differs by crew, a feeder or transformer failure found after customers are already dark, and an approved procedure that sits in a shared drive while the event is live. Most of that is already in EMS, OMS, SCADA and CMMS — after the fact.

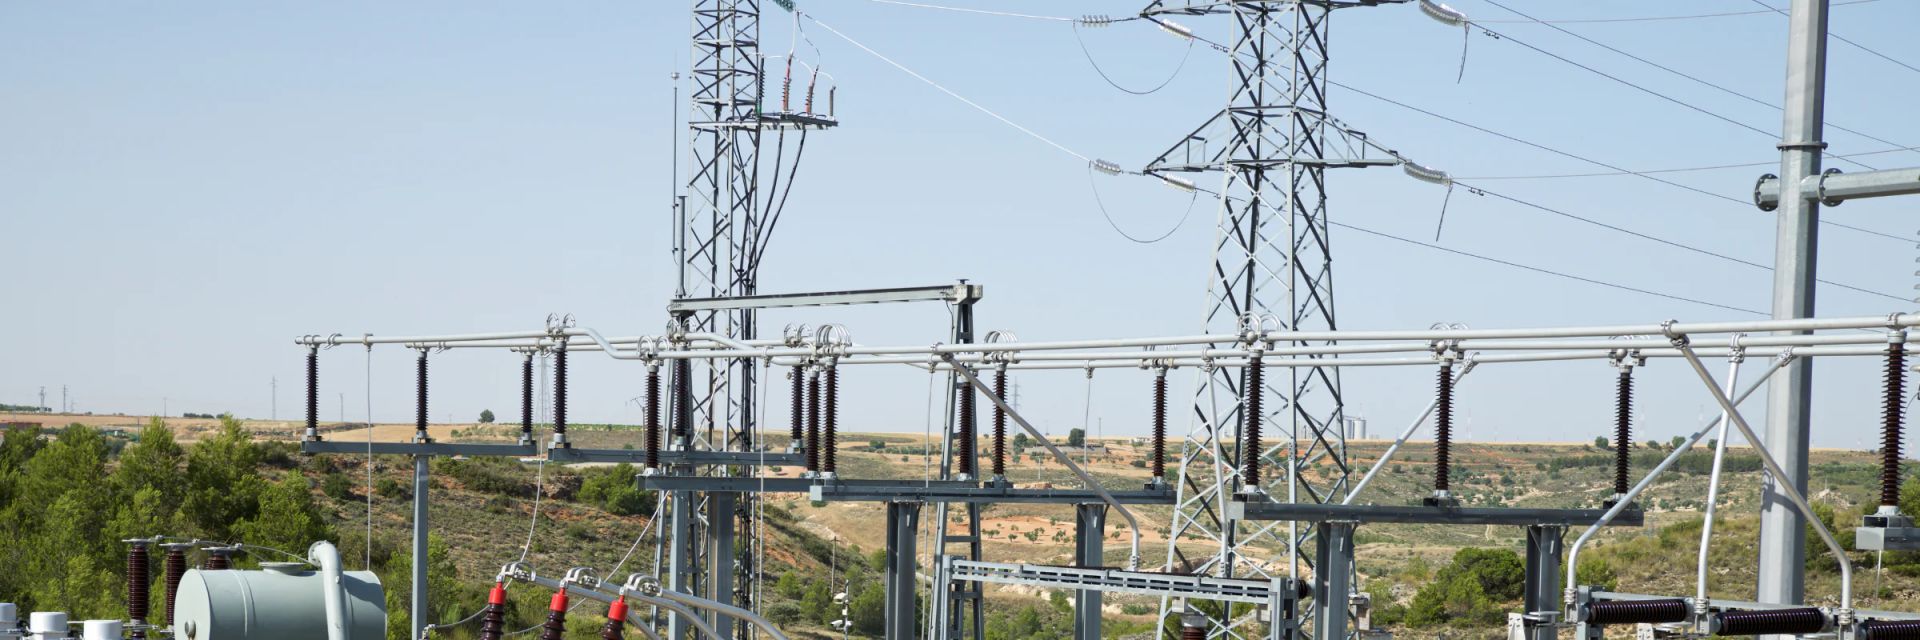
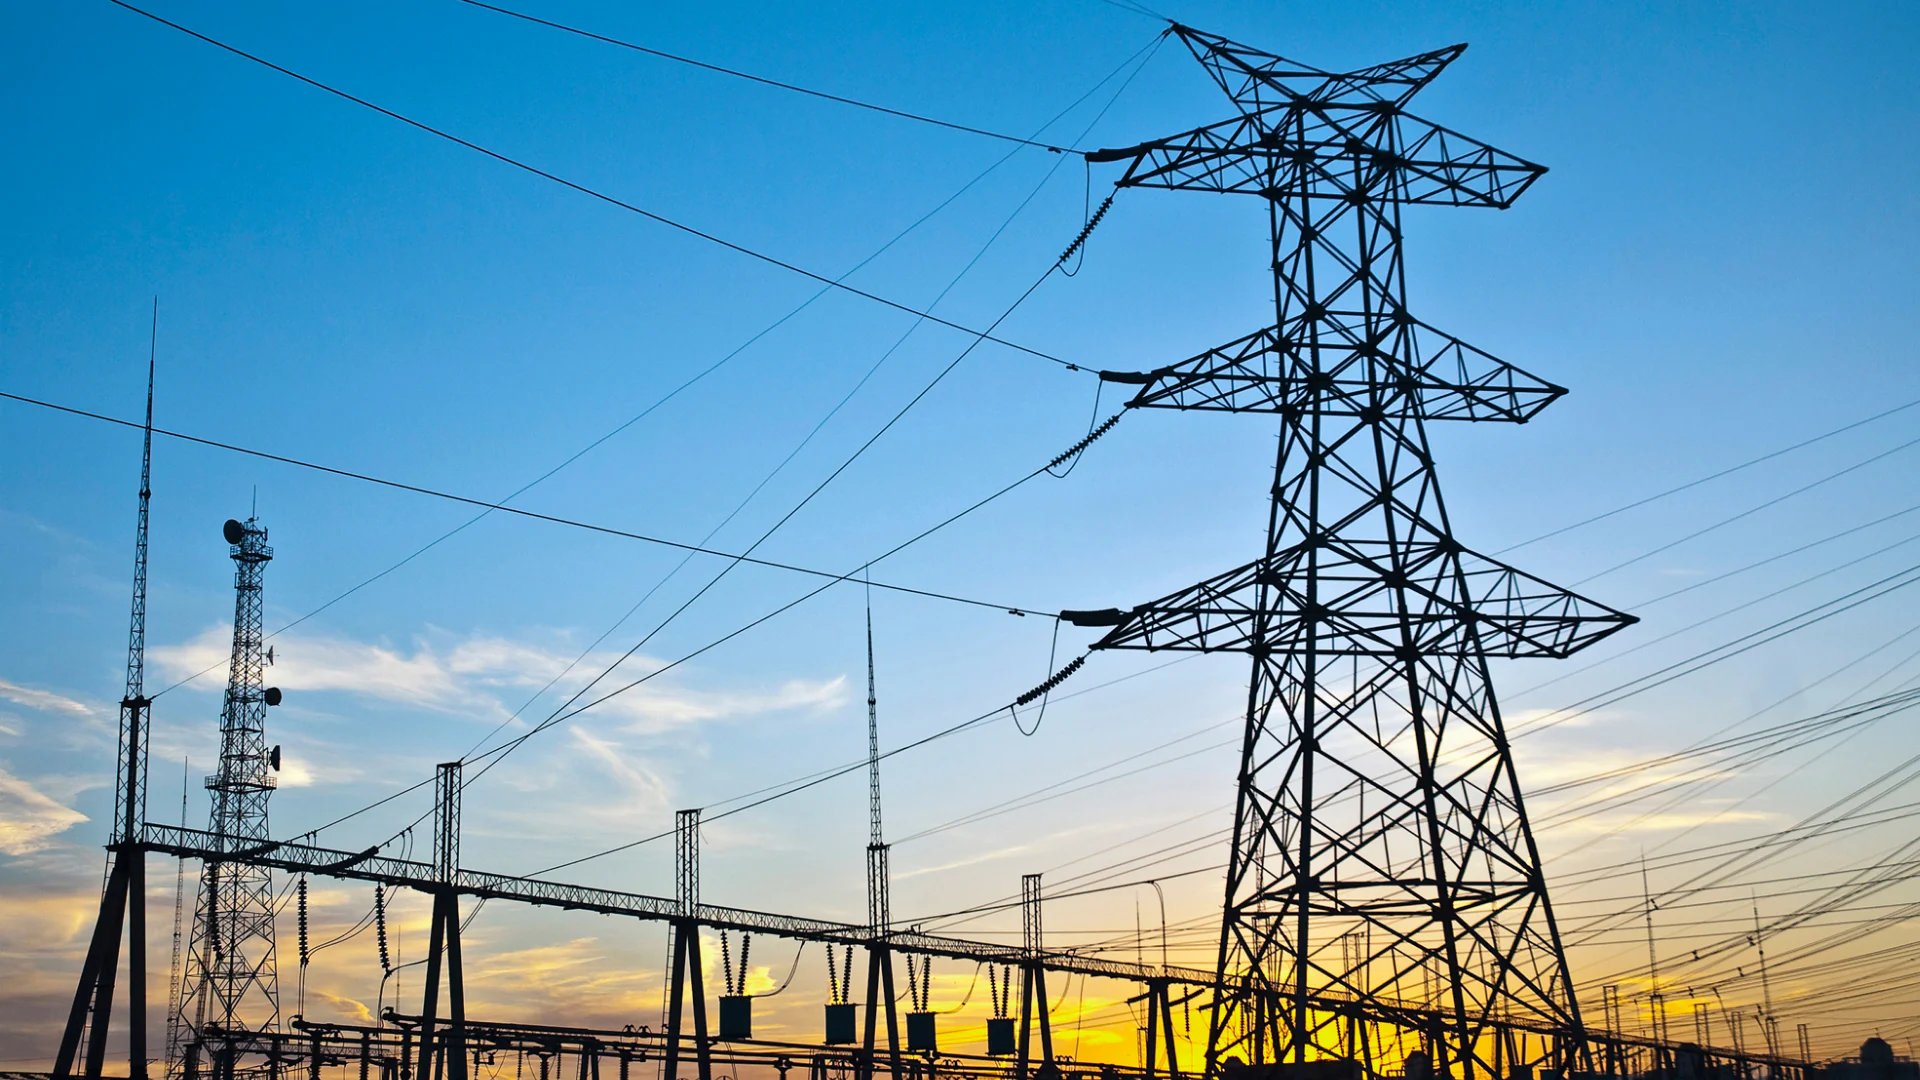
Electric utility distribution and transmission networkThe network

Major outages still cost customers billions

Published national analyses put the customer cost of major U.S. outages in the tens of billions of dollars a year, with counts and durations rising. That cost starts as a grid event — congestion, storm damage, equipment failure — before it becomes a call-center queue.
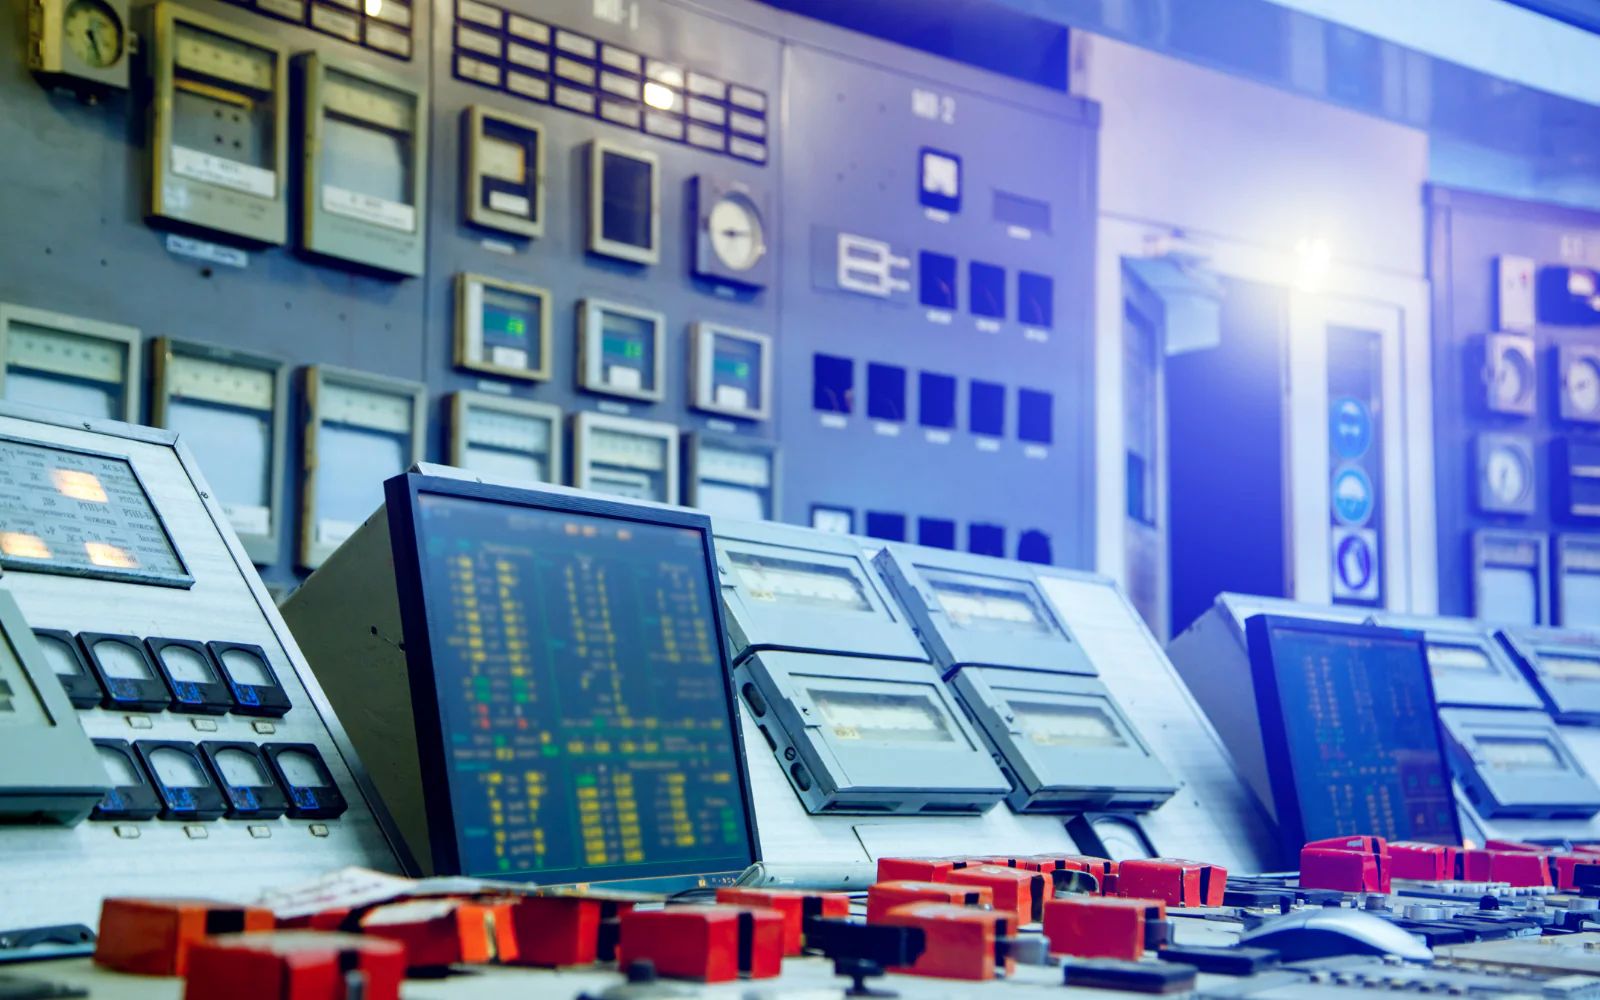
Utility outage and switching procedure documentsOutages

Restoration quality depends on the approved sequence

Isolation, LOTO and restoration sheets often sit apart from the live incident. When the approved pack is hard to find, shifts and contractors invent the next step — and the outage clock keeps running.

Substation and feeder equipment condition monitoringAssets

Substation and feeder assets sit on the path to SAIDI

Transformers, breakers, reclosers and lines decide whether capacity is real for the customer. When condition is read reactively, an unplanned stop cascades into prolonged interruption and overtime.

Restoring by habit is the easy correction. It is also how the night is spent.

INSUS works from SCADA and OMS tags, outage tickets, switching packs and equipment logs a utility already keeps. If the gap is an unread transformer alarm, a feeder that never settled, or a clearance sheet that never joined the event, that is what we will say. Recommendations stay advisory. Existing EMS, SCADA and protection systems stay in charge.

Explore the possibilities

Industry figures

The scale of what is being decided

Four external figures, each with its source. Nothing on this page is an estimate we made up. Where we cannot cite a number, we describe the situation in words instead.

EFORd spread

0.15–5.85%

EFORd range for combined-cycle resources across FERC Common Metrics respondents (2023) — showing how much availability can differ even within one technology class. Utility planning still depends on whether capacity shows up when demand does.

Source: FERC, 2023 Common Metrics Report

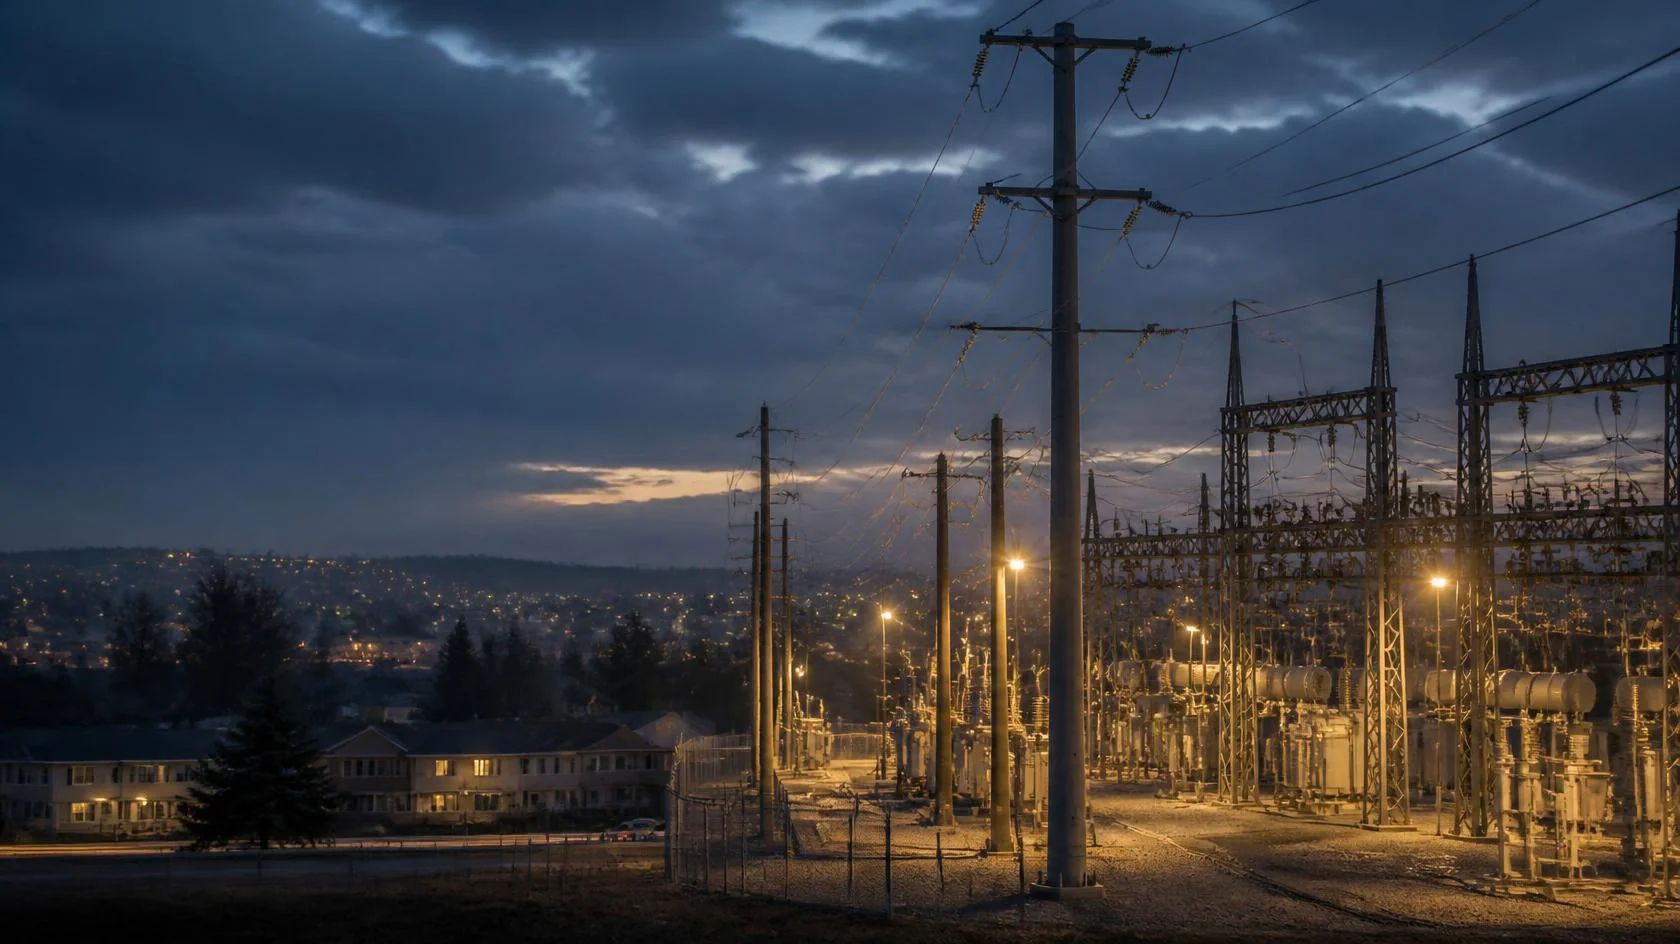
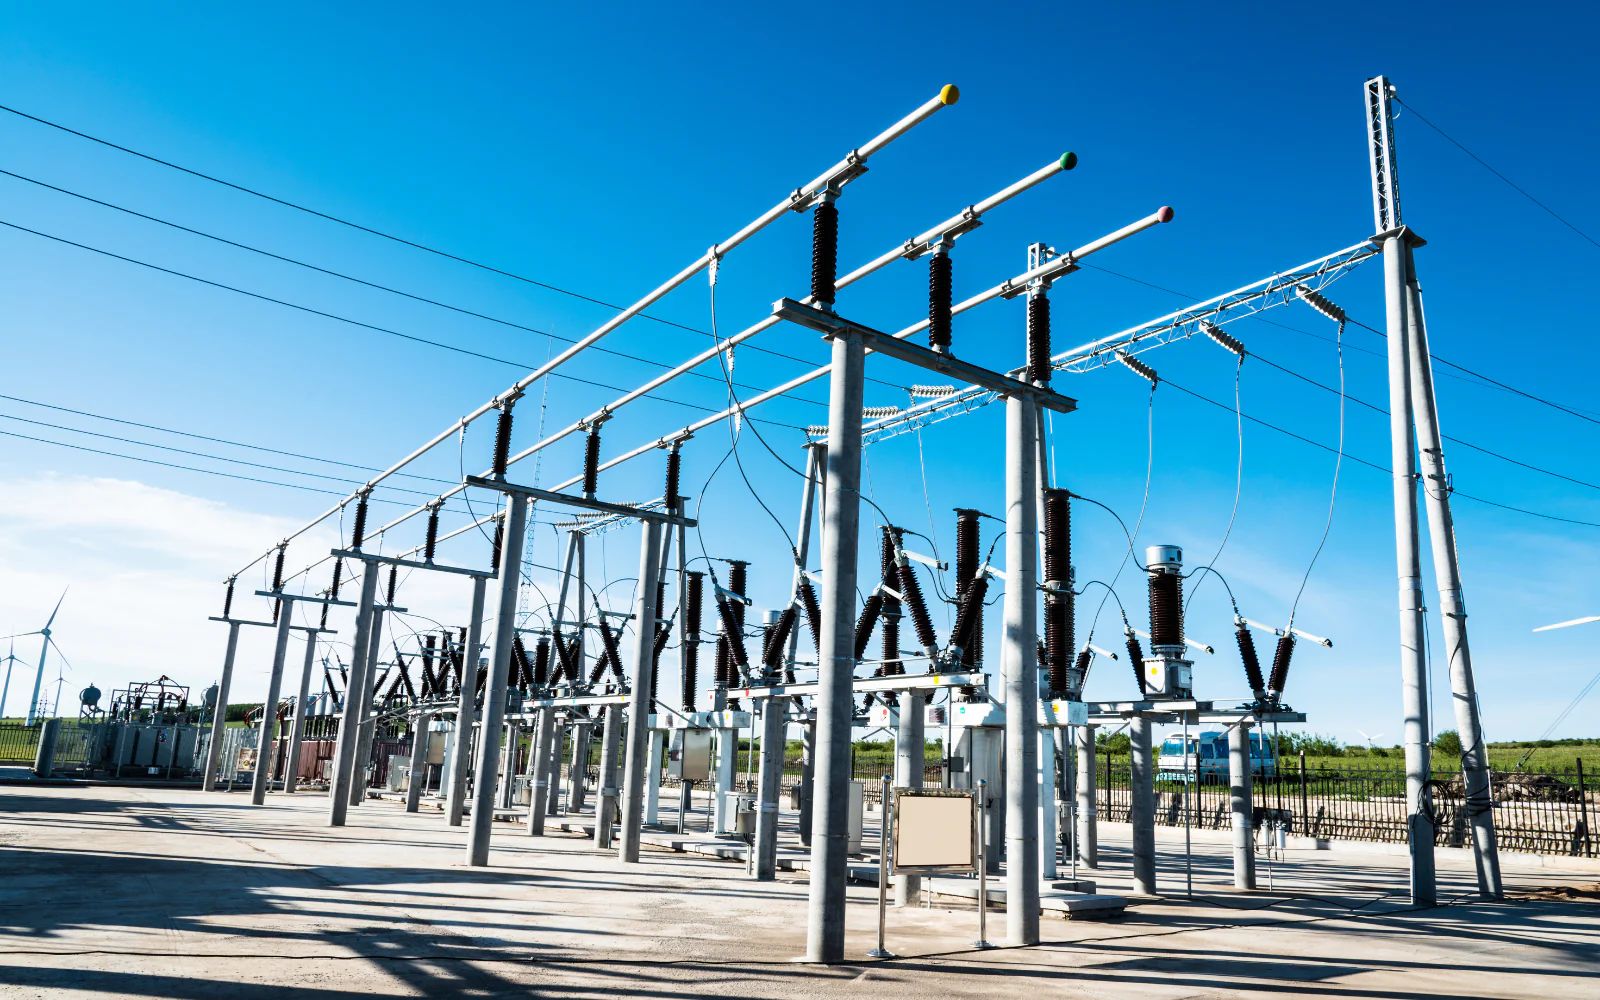
Utility substation and distribution operations

Common problems

Problems that cost you before you notice

None of these show up as a single alarm. They show up in the transformer that looked fine on average accuracy, the inspection that found nothing, and the report assembled after the clock has started.

  1. Overall accuracy can hide the transformers that matter most

    Healthy assets dominate historical test datasets. A model can look strong overall while still missing Poor and Very Poor units — the ones that drive outages and capital risk.

    See: Transformer Health Index Prediction
  2. Theft inspections are still aimed by chance or complaint

    Random or complaint-triggered visits spread capacity across accounts with no data-driven ranking. Consumption anomalies theft produces are rarely modelled continuously across the customer base.

    See: Electricity Theft Detection
  3. Incident reporting is still assembled after the clock has started

    NIS2 and electricity Network Code obligations sit apart from incident-response packs. When an event hits, teams rebuild classification, evidence and reporting steps under the early-warning deadline.

    See: NIS2 Cybersecurity Compliance

Use cases

Places worth a closer look

Each is a specific starting point — this transformer fleet segment, this customer territory — and a next conversation if it is worth your time.

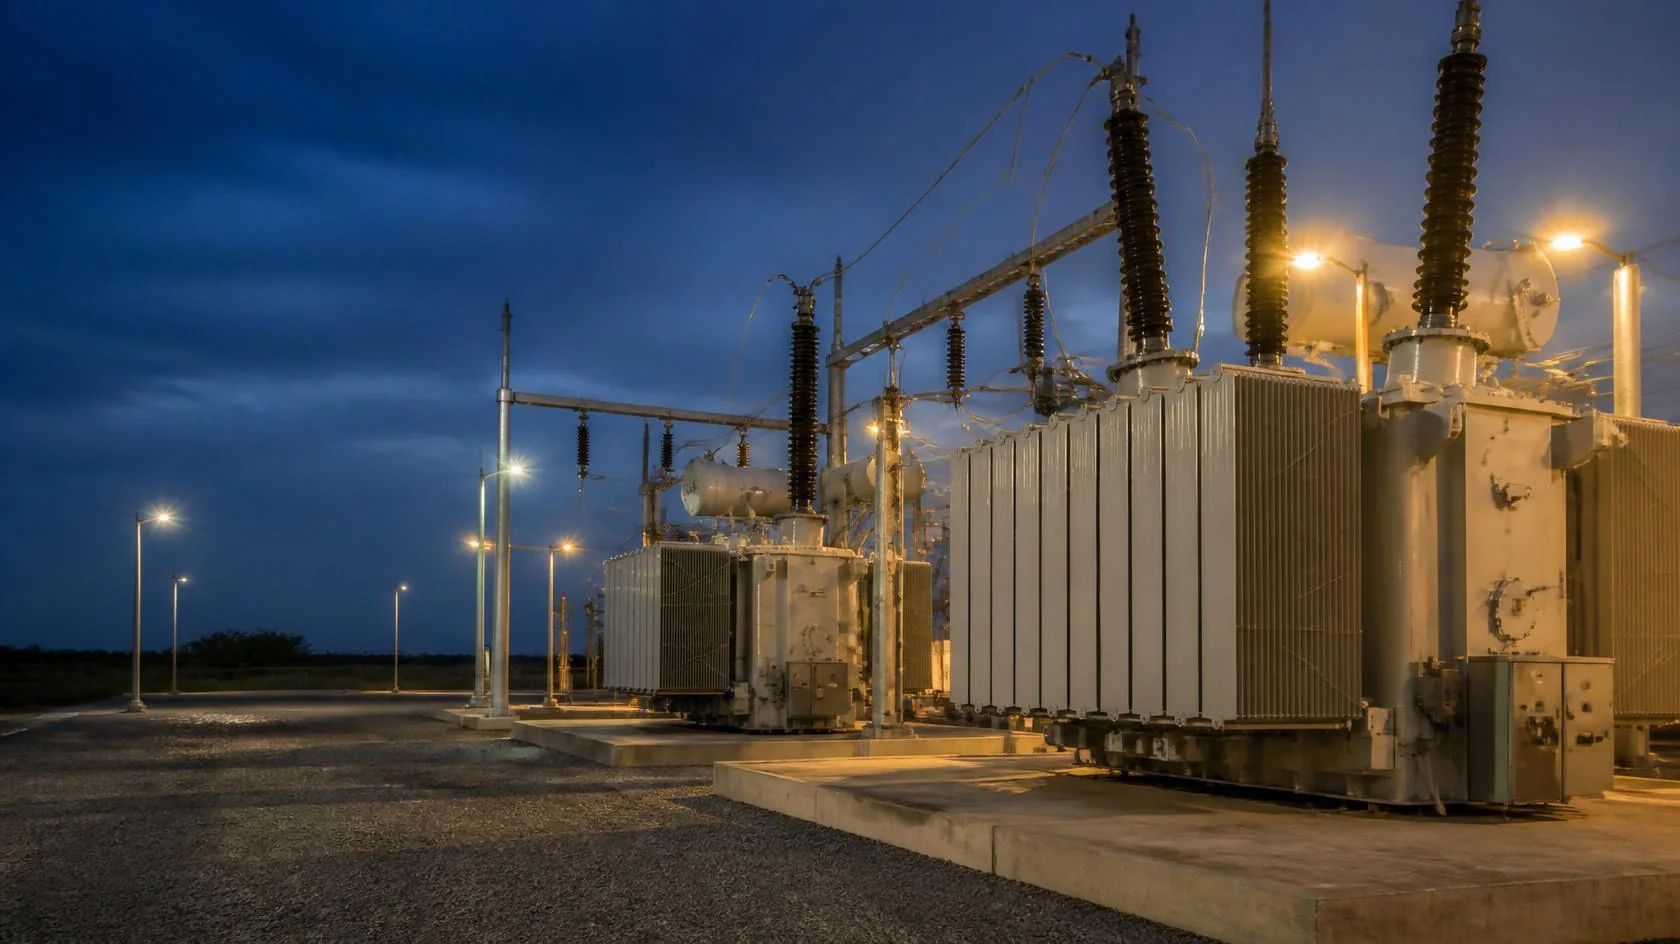
Power transformer fleet with health index and test history monitoring
Asset health

Transformer Health Index Prediction

Predict transformer health index from oil quality, DGA and paper-condition data your utility already collects, with attention to rare high-risk classes. Advisory only.

See the full use case
Distribution network with consumption anomaly and theft detection monitoring
Revenue protection

Electricity Theft Detection

Detect likely electricity theft and non-technical losses from consumption data your utility already bills against, and prioritise field inspections for human review. Advisory only.

See the full use case
Utility compliance dashboard for NIS2 obligations and incident reporting readiness
Cybersecurity compliance

NIS2 Cybersecurity Compliance

Map NIS2 cybersecurity obligations and electricity Network Code requirements, surface documentation gaps and prepare incident-reporting workflows for human review. Not a legal determination.

See the full use case

FAQ

Questions that come up in every first call

A practical look at what INSUS needs, where it fits and what your team can expect.

The work that fits is the data a T&D utility already produces: SCADA and OMS tags, outage tickets, switching packs and equipment condition signals. Predictive Maintenance can start from signals you already log. Closed-loop protection and automatic switching are not promises we will make on day one.

Energy & Utilities is the parent overview across power, grid, renewables, water and waste. Power focuses on generating units — heat rate and plant availability. Utilities focuses on transmission and distribution — outages, switching, feeders and substations.

Usually not for SCADA, OMS and maintenance. Most utilities already have feeder and substation tags plus trouble history. If a critical sensor has been drifting or an alarm code is unused, that comes before any model.

No. The person who knows this feeder, this substation and this protection scheme stays responsible. The aim is to stop the next event repeating the same restoration miss, and to flag a developing equipment issue before it prolongs the outage.

No. It advises the control-room or field team. Existing EMS, SCADA and protection systems stay in charge of the loop. Protection systems are not touched.

No. Reliability depends on weather, vegetation, equipment condition and operating practice. We will not invent a SAIDI or CAIDI target for your system.

They are published U.S. national estimates — not measurements of your circuits. Your OMS, SCADA and work orders are the numbers that matter.

Yes. One feeder, one substation, or one outage program is usually the practical start. Measure that, then decide whether to widen.

Contact

Talk to a utilities expert

  • 30 minA focused conversation about the utilities problem you are trying to solve. No sales deck.
  • OutcomeA practical view of whether INSUS can help, what data would be needed and where it makes sense to start.
  • We will first understand your current process, what information you have and where the biggest gap is.
  • If the right answer is a sensor check, a procedure update, a maintenance action or an existing OMS report, that is what we will tell you.

Request a call

We reply within one working day, from a person, with a proposed time.