Water industry

Where the cubic metrepays for the miss

Water is already treated and pumped. Leakage and energy show up after the network has moved. Quality drifts before the sample is confirmed. The utility still has to deliver.

  • 01

    Aeration matched to this hour's load, not the worst case

    Predict the dissolved oxygen setpoint from flow, MLSS and nitrogen data the plant already logs, so blower energy follows treatment need rather than a standing margin.

  • 02

    The coagulant dose before the jar test catches up

    Predict dosing from turbidity, pH and other raw water measurements the plant already logs, so recommendations update as incoming conditions change.

  • 03

    Every agglomeration against every applicable deadline

    Map Directive (EU) 2024/3019 treatment and energy-neutrality obligations to the plants you already have on record, so gaps surface before the planning window closes.

On the network and at the plant

The margin is decided between production and the meter

Water utilities lose money in three places that rarely share one screen: treated water lost before it is billed, pumps and processes that burn energy to cover uncertainty, and a quality or asset failure found after supply is already at risk. Most of that is already in SCADA, AMI, LIMS and CMMS — after the fact.

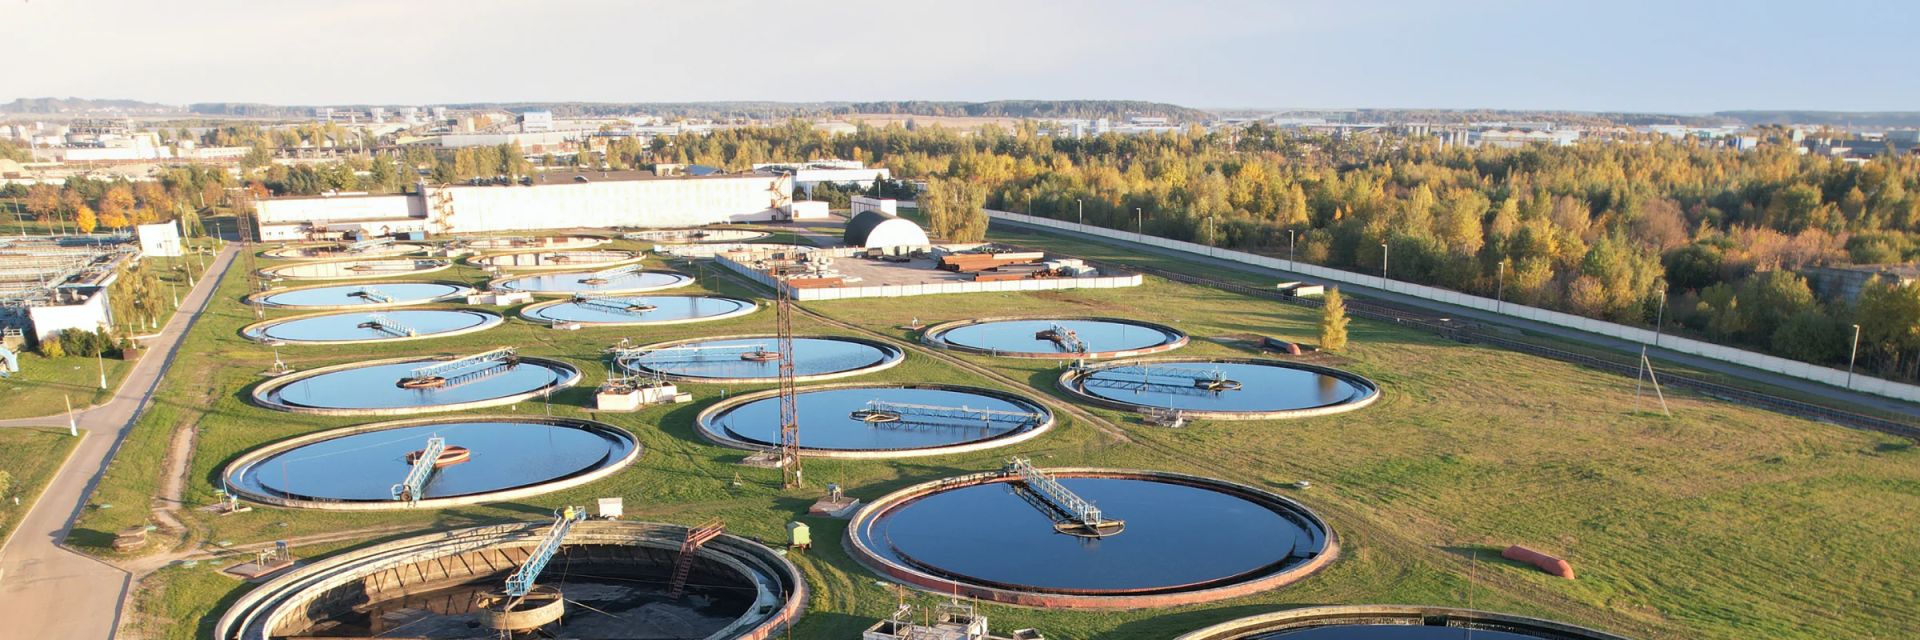
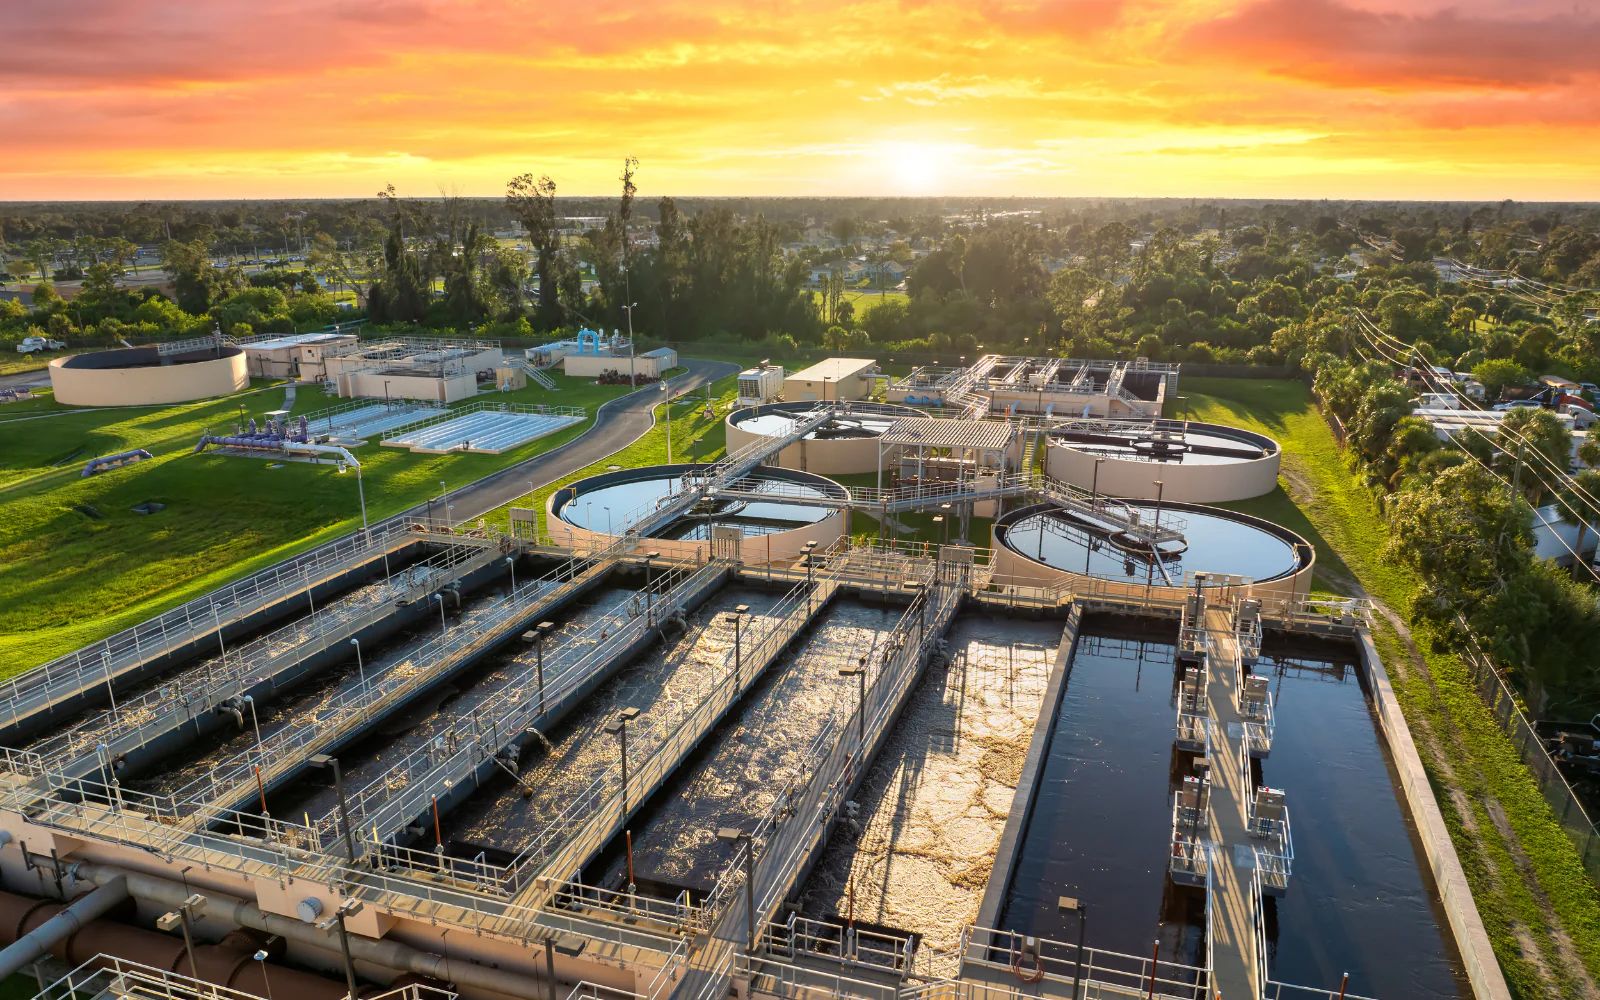
Water distribution network and pumping infrastructureThe network

Non-revenue water is treated volume that never earns a bill

Global average NRW remains on the order of 30%. Every cubic metre lost to leakage or apparent loss was already abstracted, treated and pumped — so the energy and chemical cost is paid twice when the network has to make up the difference.
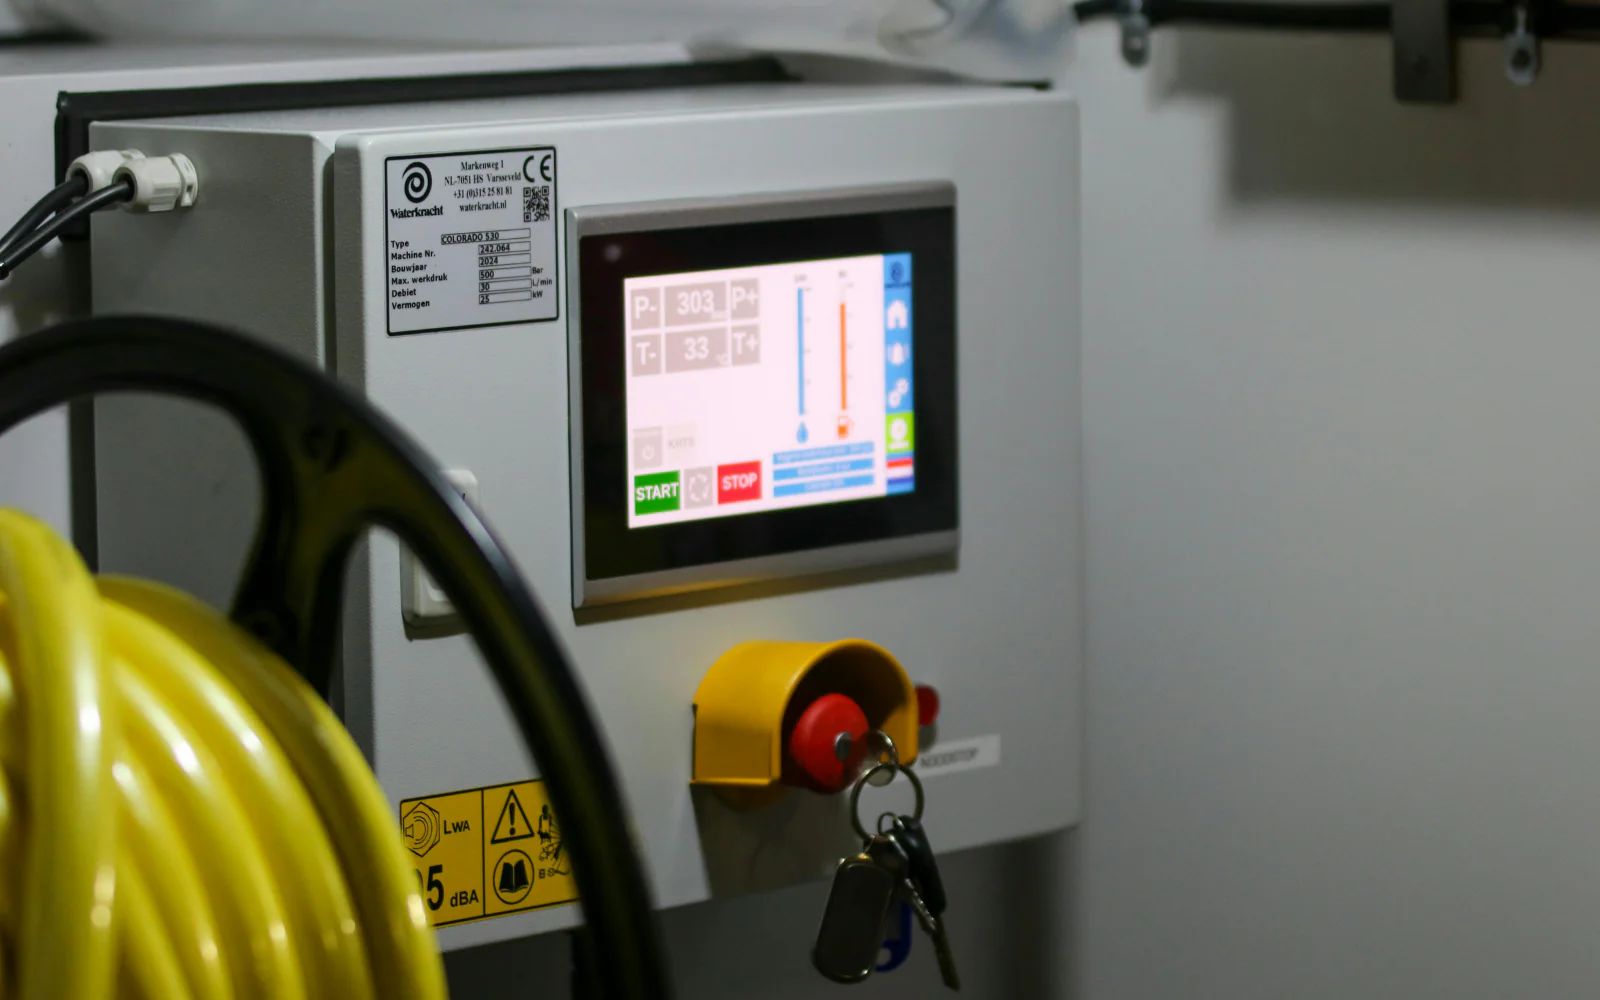
Water utility pumping and energy systemsEnergy

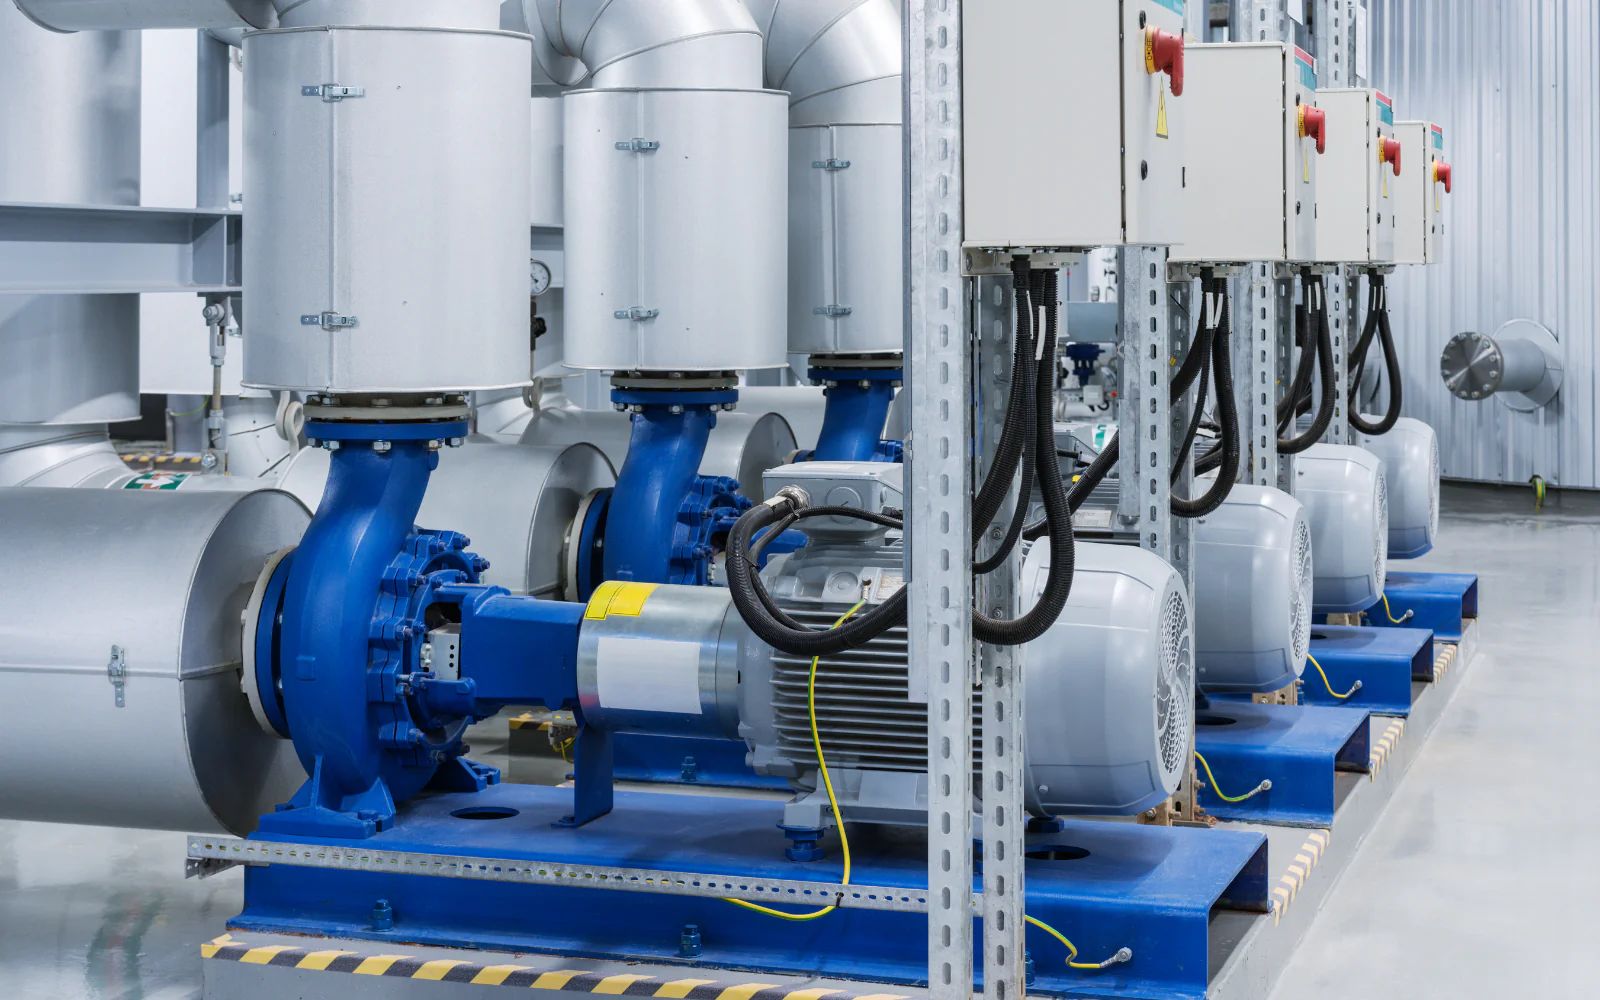
Pumping dominates the controllable utility cost

Drinking water and wastewater systems are often a municipality’s largest energy users. At the plant and in the network, pumping typically accounts for most of the electricity — which means pressure, leakage and scheduling decisions write the power bill.

Water utility work order and quality documentsThe record

Bursts, clearances and lab results still live apart

DMA balances, work orders and water-quality tickets often sit in separate systems. When the approved isolation or sample history is hard to find, crews invent the next step under pressure.

Raising pressure is the easy correction. It is also how the night is spent.

INSUS works from network and plant tags, night-flow and NRW balances, work orders and equipment logs a utility already keeps. If the gap is an unread pump alarm, a DMA that never settled, or a clearance sheet that never joined the event, that is what we will say. Recommendations stay advisory. Existing SCADA, PLC and plant controls stay in charge.

Explore the possibilities

Industry figures

The scale of what is being decided

Four external figures, each with its source. Nothing on this page is an estimate we made up. Where we cannot cite a number, we describe the situation in words instead.

Municipal energy

30–40%

of a typical municipality’s energy bill can be attributable to drinking water and wastewater plants, which EPA notes are often a local government’s largest energy consumers.

Source: U.S. EPA, Energy Efficiency for Water Utilities

U.S. energy share

~2%

of U.S. energy use is accounted for by drinking water and wastewater systems, adding over 45 million tons of greenhouse gases annually, according to EPA — a national reminder that every leaked or over-pumped cubic metre carries an energy cost.

Source: U.S. EPA, Energy Efficiency for Water Utilities

Water treatment plant and distribution operations

Common problems

Problems that cost you before you notice

None of these show up as a single alarm. They show up in the blower energy bill, the chemical invoice between jar tests, and the directive deadline nobody had mapped.

  1. Aeration blowers run to a setpoint set for the heaviest load

    Fixed or conservatively high dissolved oxygen setpoints protect treatment across variable loading — and keep supplying oxygen whenever the load is lighter than the case the setpoint was chosen for.

    See: Aeration Energy & DO Optimization
  2. Coagulant dose waits on the jar test while raw water has already moved

    Too little coagulant risks turbidity removal; too much spends chemical and sludge capacity. Between periodic tests, dosing often rests on experience rather than a model of this plant's own quality-to-dose relationship.

    See: Coagulant Dosing Prediction
  3. Directive deadlines differ by agglomeration, and the map lives in spreadsheets

    Secondary, tertiary and quaternary treatment and energy neutrality arrive through staggered thresholds. Across a multi-plant portfolio, which obligation applies where is easy to lose between regulatory text and plant records.

    See: UWWTD Compliance Roadmap

Use cases

Places worth a closer look

Each is a specific starting point — this aeration train, this treatment plant — and a next conversation if it is worth your time.

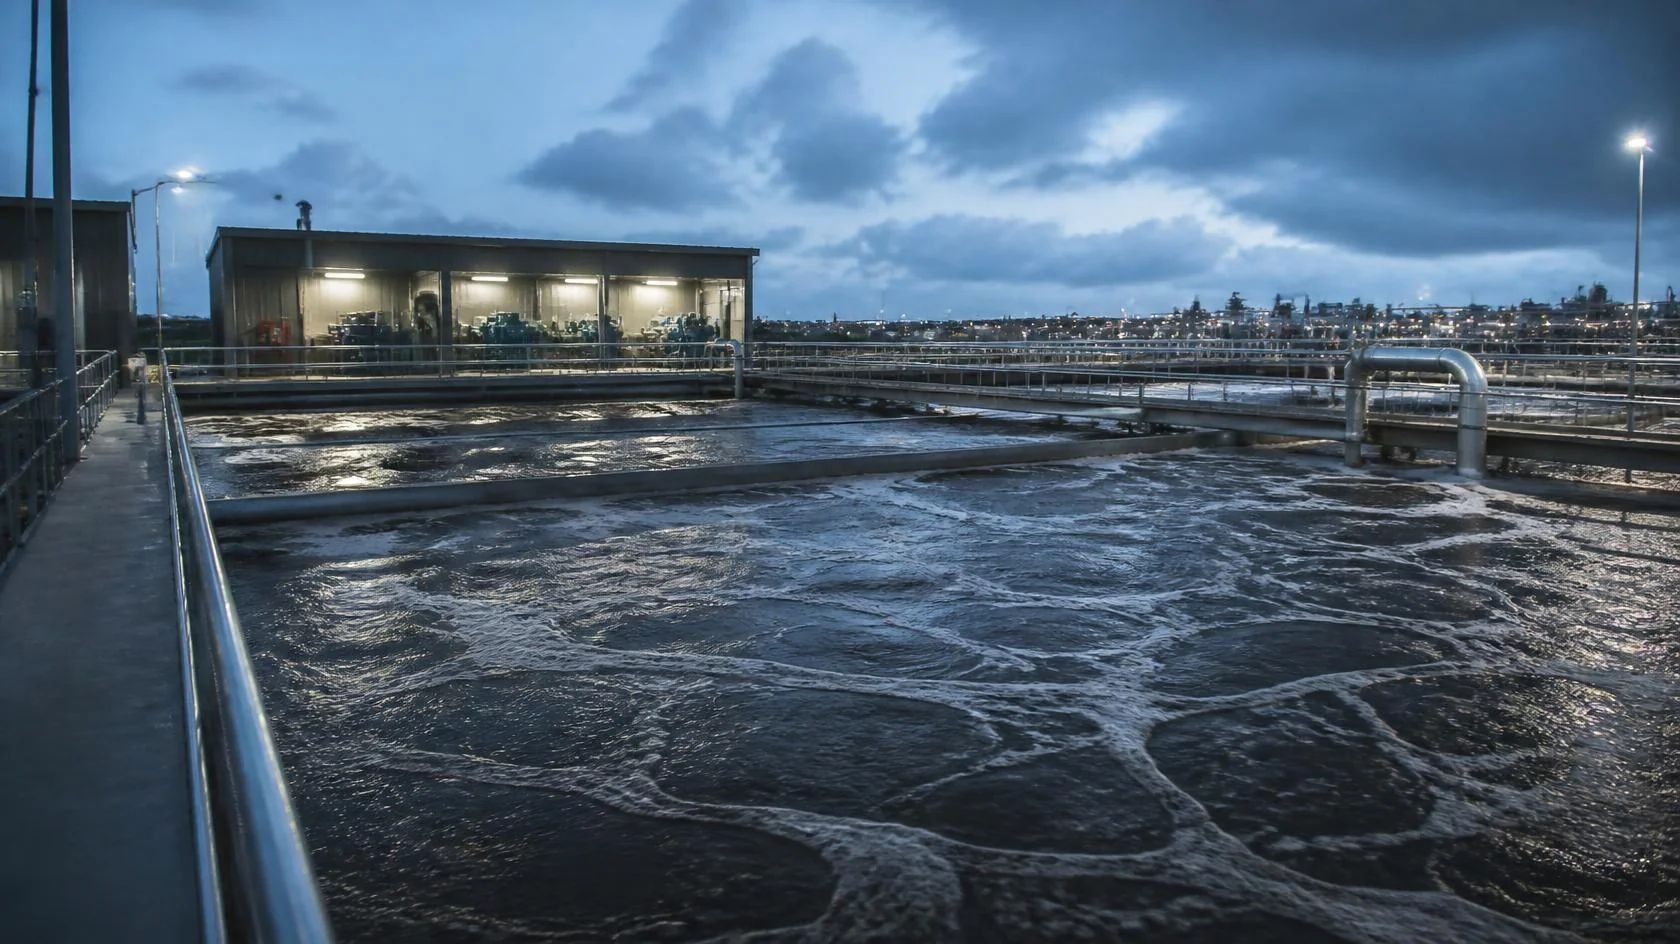
Activated sludge aeration tank with dissolved oxygen and blower monitoring
Treatment

Aeration Energy & DO Optimization

Predict the dissolved oxygen setpoint wastewater aeration needs from flow, MLSS and nitrogen the plant already logs, so blower energy follows treatment load. Advisory only.

See the full use case
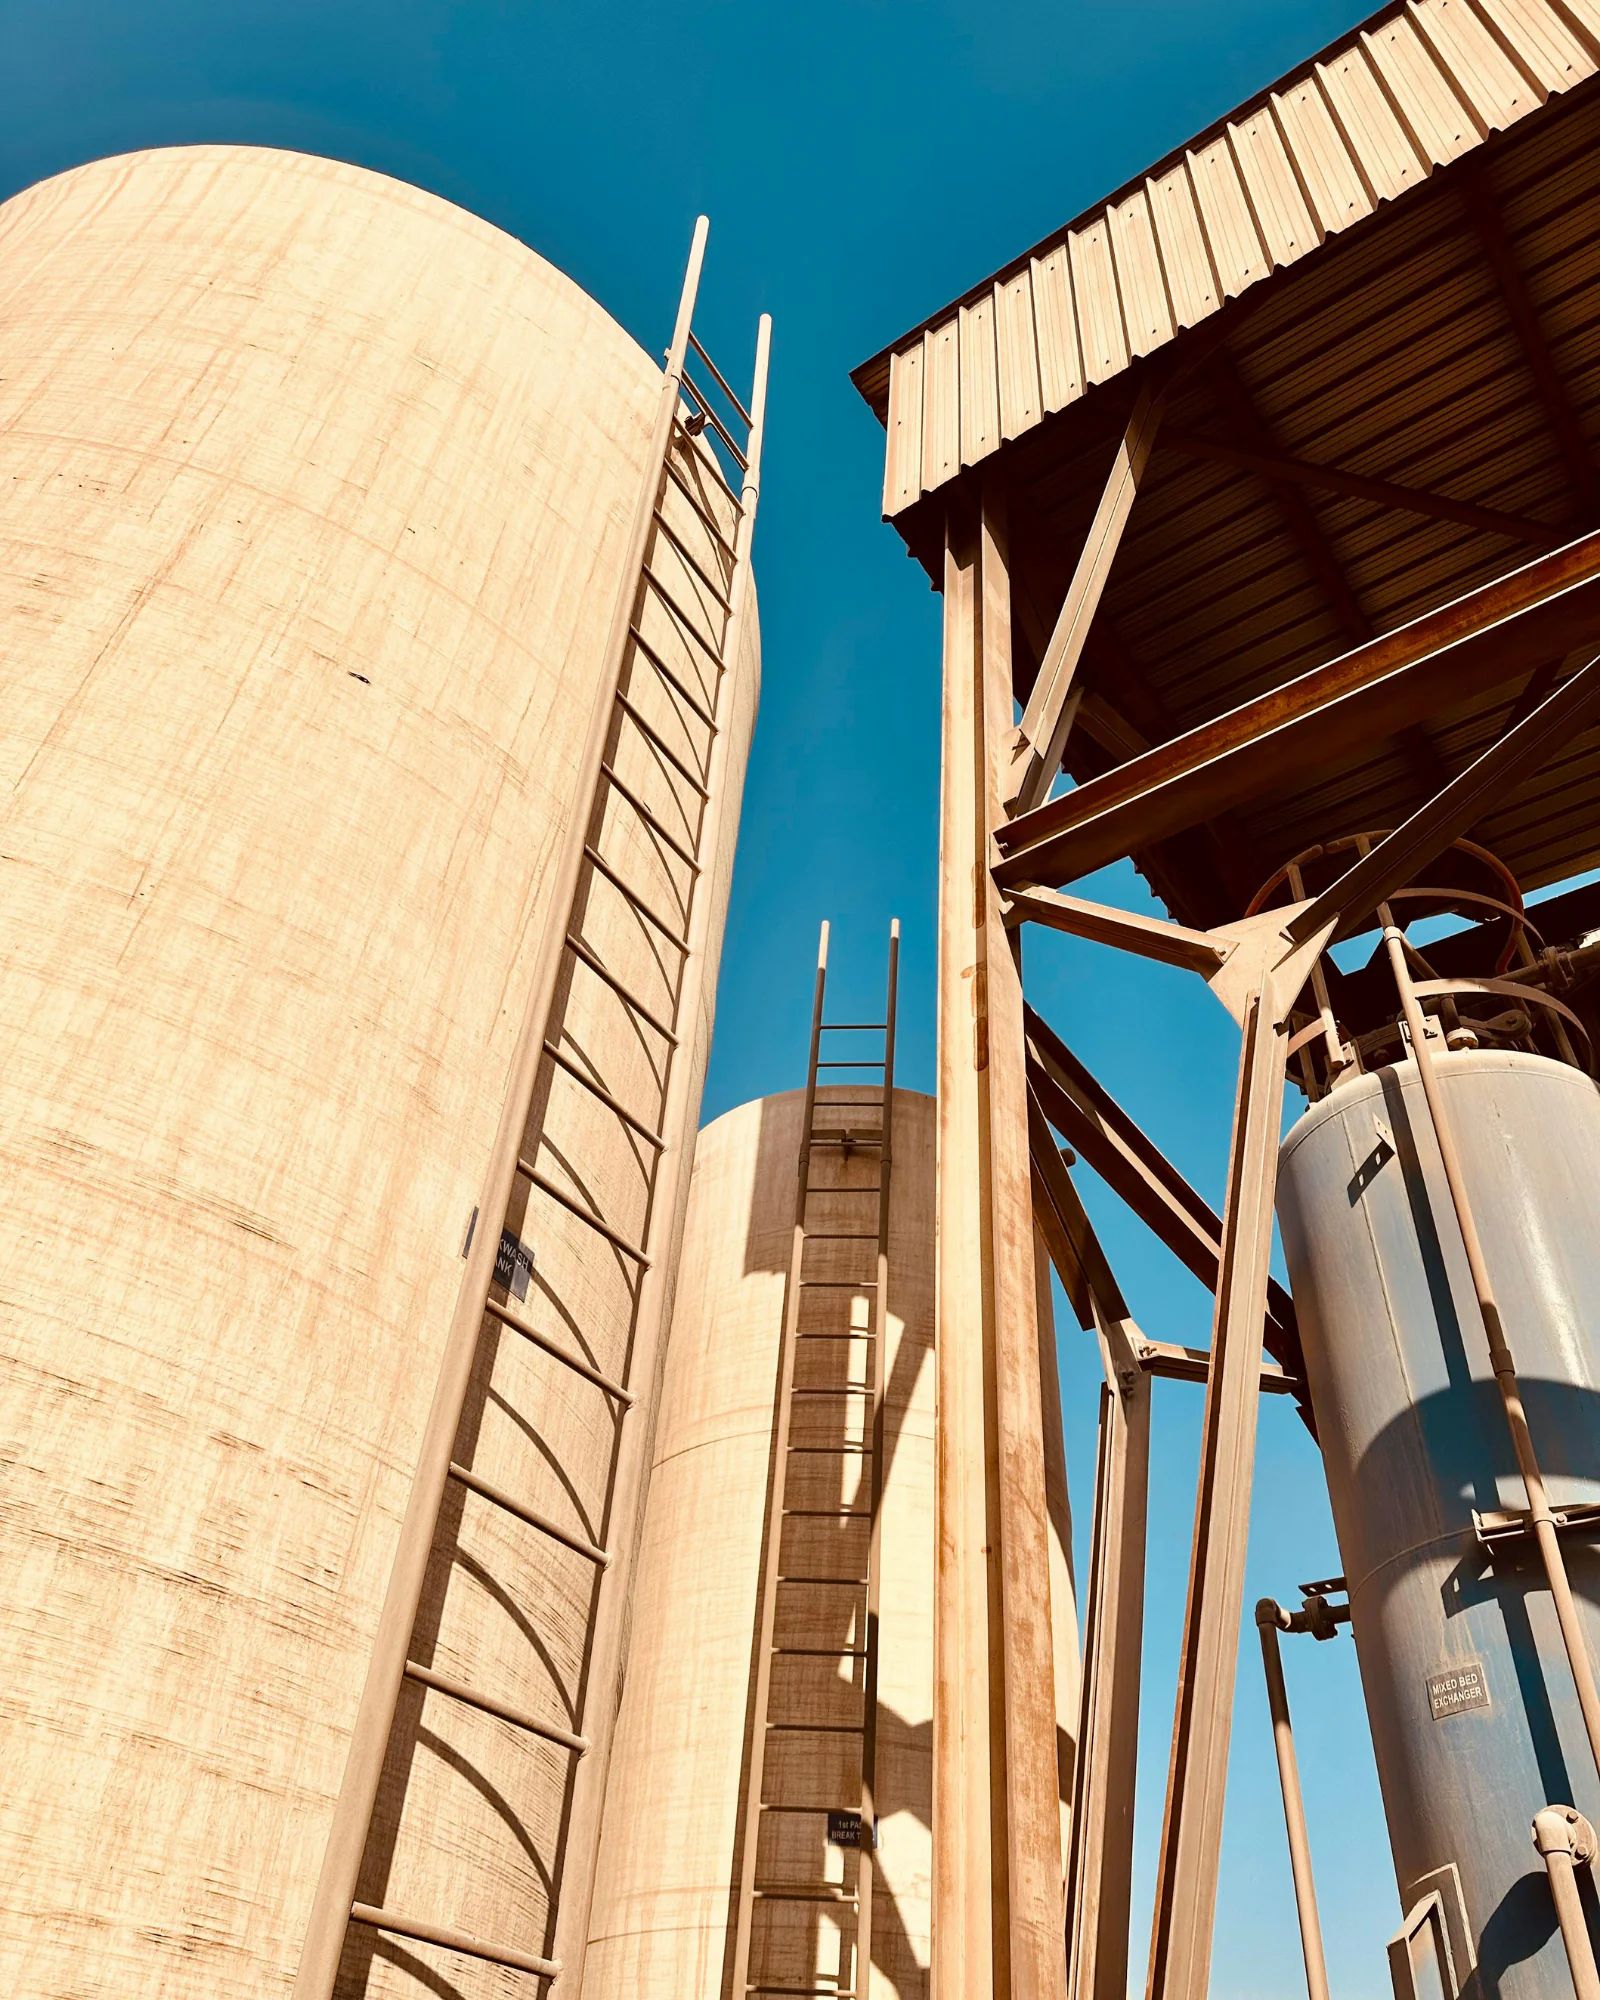
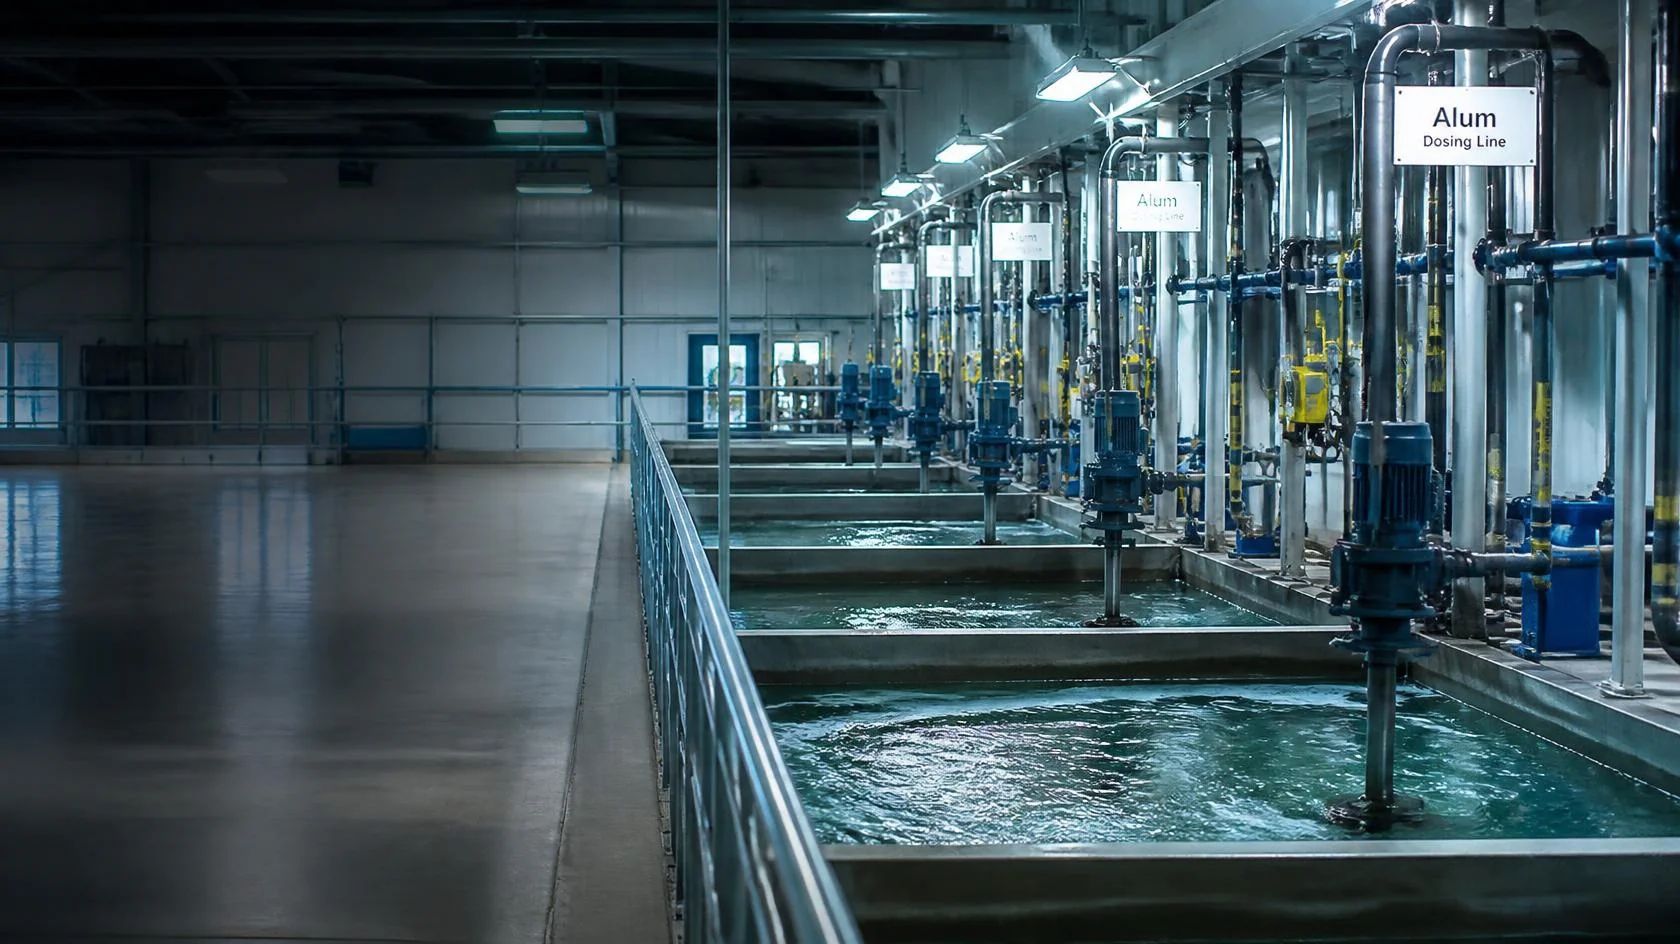
Drinking water coagulation stage with coagulant dosing and raw water quality trends
Treatment

Coagulant Dosing Prediction

Predict drinking water coagulant dose from turbidity, pH, temperature, conductivity and color the plant already measures. Jar tests stay for verification. Advisory only.

See the full use case
Wastewater portfolio mapped against UWWTD treatment deadlines and obligations
Regulatory compliance

UWWTD Compliance Roadmap

Map wastewater agglomerations and plants against Directive (EU) 2024/3019 treatment, coverage and energy-neutrality obligations for compliance review. Not a legal determination.

See the full use case

FAQ

Questions that come up in every first call

A practical look at what INSUS needs, where it fits and what your team can expect.

The work that fits is the data a water utility already produces: network and plant SCADA tags, DMA and NRW balances, lab results, work orders and equipment condition signals. Predictive Maintenance can start from signals you already log. Closed-loop network control and automatic chemical dosing are not promises we will make on day one.

Energy & Utilities is the parent overview across power, grid, renewables, water and waste. Water focuses on drinking water treatment and distribution — NRW, pumping energy, process guidance and plant assets. Waste covers solid waste and wastewater process energy separately.

Usually not for SCADA, historians and maintenance. Most utilities already have pressure, flow and pump tags, plus some DMA metering. If a critical meter has been drifting or a night-flow logger is unused, that comes before any model.

No. The person who knows this DMA, this plant and this source stays responsible. The aim is to stop the next night repeating the same loss or energy waste, and to flag a developing equipment issue before it stops supply.

No. It advises the control-room or engineering team. Existing SCADA, PLC and safety interlocks stay in charge of the loop. Protection systems are not touched.

No. Leakage and energy depend on network condition, topography, demand, equipment and operating practice. We will not invent an NRW or kWh/m³ target for your utility.

They are published national and international benchmarks — not measurements of your system. Your DMA balances, SCADA and work orders are the numbers that matter.

Yes. One DMA, one treatment train, or one pump station is usually the practical start. Measure that, then decide whether to widen.

Contact

Talk to a water expert

  • 30 minA focused conversation about the water utility problem you are trying to solve. No sales deck.
  • OutcomeA practical view of whether INSUS can help, what data would be needed and where it makes sense to start.
  • We will first understand your current process, what information you have and where the biggest gap is.
  • If the right answer is a meter check, a procedure update, a maintenance action or an existing SCADA report, that is what we will tell you.

Request a call

We reply within one working day, from a person, with a proposed time.