Your repair rate is rising.But what is driving it?

INSUS connects existing weld repair and inspection records with fit-up, joint, station and welder-assignment data to surface the conditions most strongly associated with rising repair rates. Quality teams keep the investigation decision.

  • 01

    Repair rates vary across fabrication operations.

  • 02

    Known causes are rarely traced through your own data.

  • 03

    Repair records connected to fit-up, station and assignment.

The problem

Everyone knows the usual suspects.Few shops can prove which one it was.

Weld repair is a recurring source of rework in machinery fabrication. Quality teams may know that fit-up, joint accessibility, welder assignment and other conditions can influence repair rates, but identifying which factor is driving a specific repair-rate change usually requires a manual investigation across multiple systems.

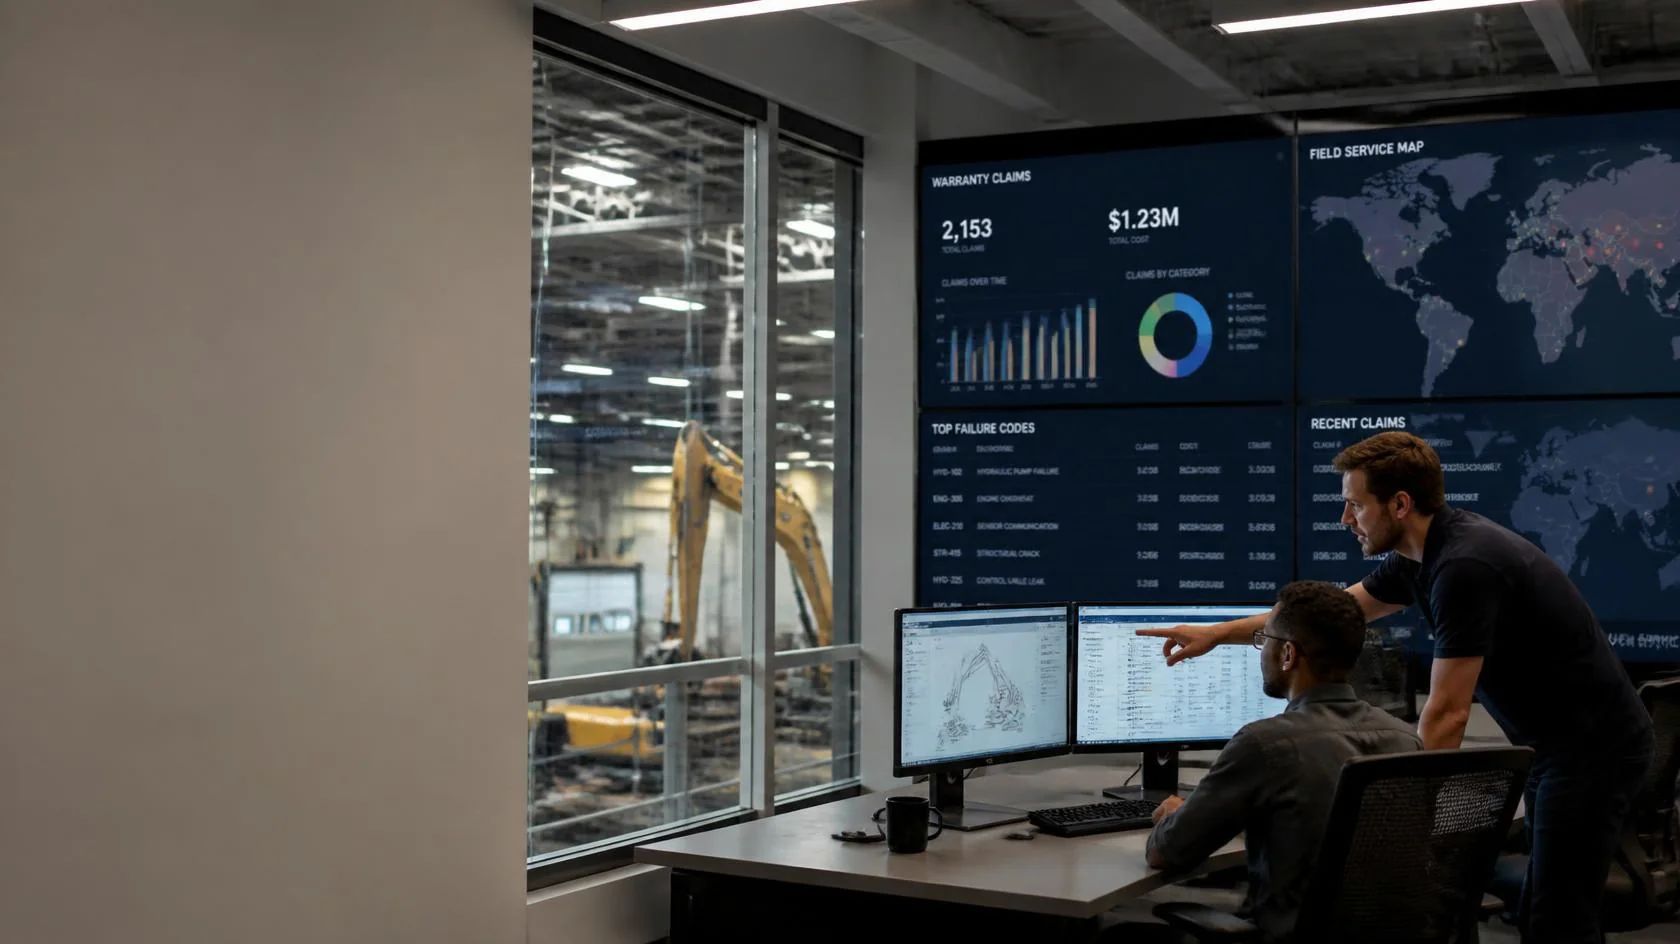
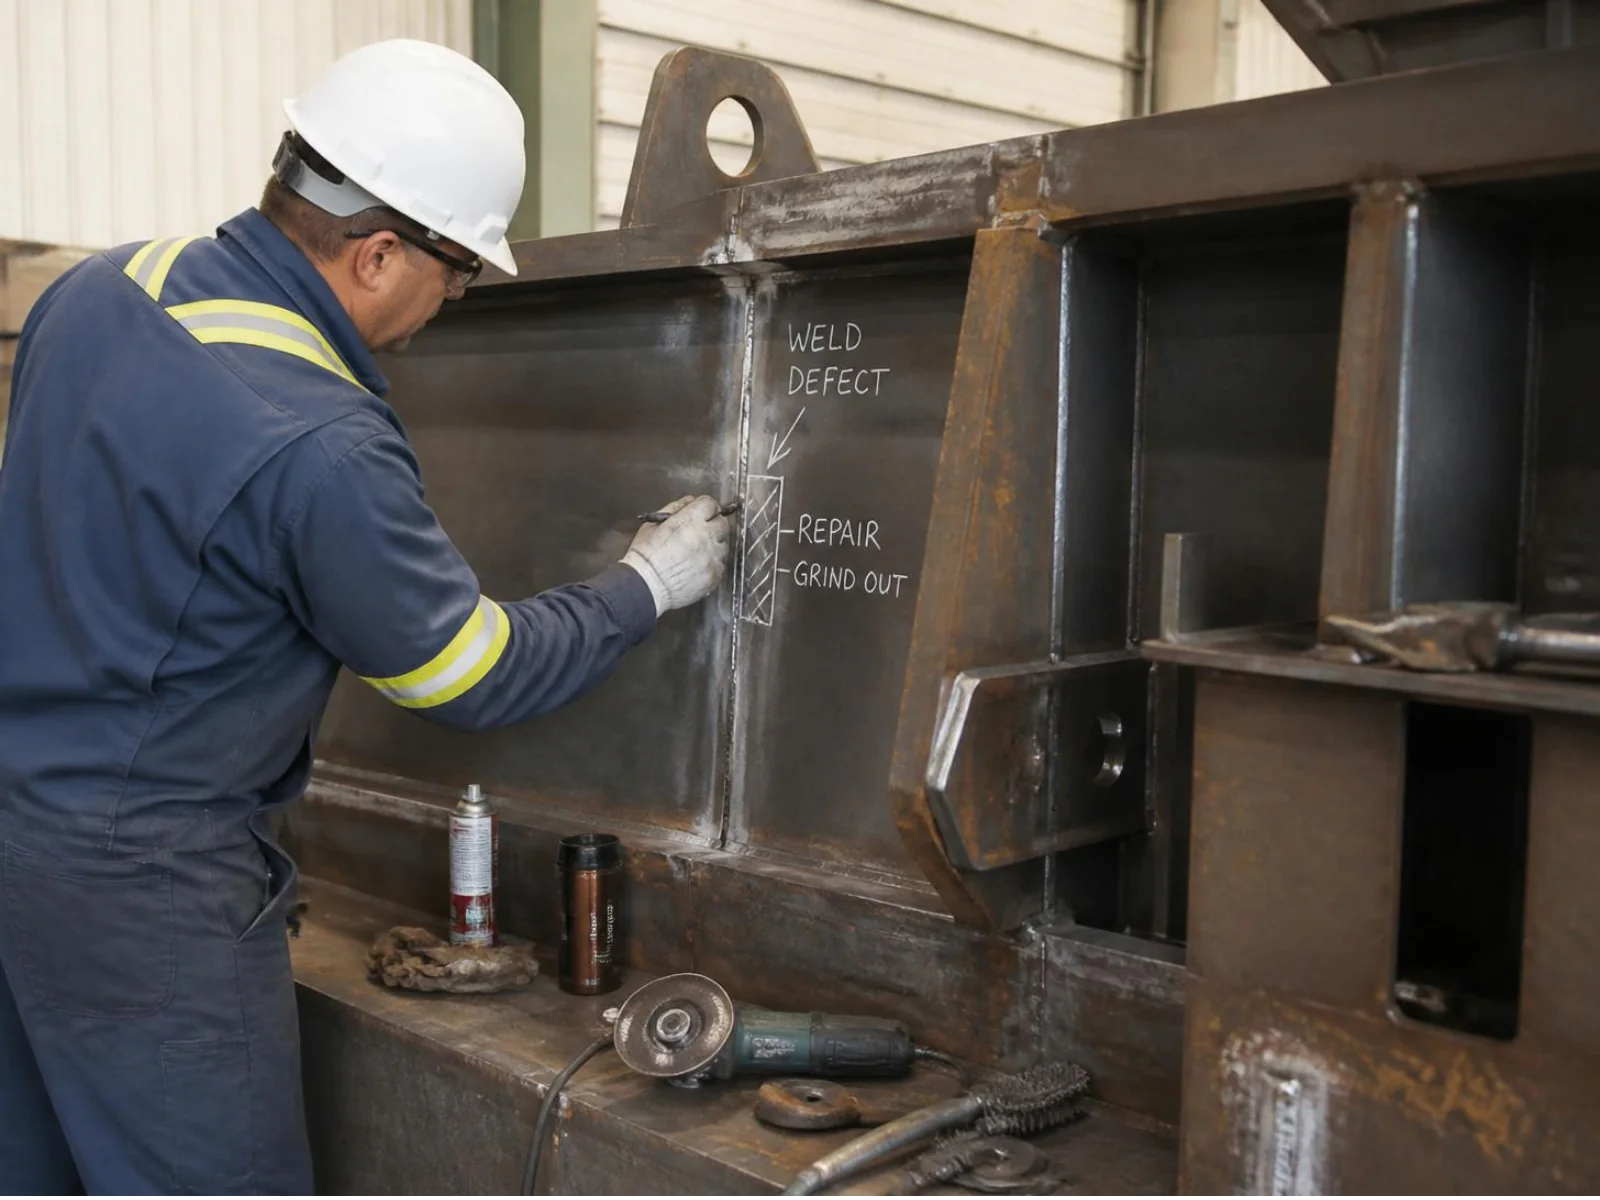
Quality engineer reviewing weld repair rates against fabrication station and job data
01
02
03
  • 01Repair-rate change
  • 02Multiple possible causes
  • 03Manual investigation

The shift

From known causes in generalto this shop's actual cause.

The opportunity is not another weld-defect detection system. It is connecting the inspection and repair data your shop already produces with the fabrication data that can explain why repair rates are changing.

Today

Repair trends without the full context

  • Repair rates are tracked in aggregate.
  • Inspection shows that a weld failed, but the upstream cause is investigated separately.
  • Root-cause investigation starts manually after a repair-rate spike becomes visible.
With INSUS

Repair trends connected to likely causes

  • Repair records are correlated with fit-up, joint, station and assignment data.
  • Likely root-cause categories are ranked from the shop's own historical relationships.
  • Quality teams start investigations with evidence rather than searching from scratch.

How it works

From repair recordsto a likely cause.

This fits OptiStudio as quality analytics and decision support over existing inspection and fabrication records. Access is read-only. It does not replace inspection or change welding parameters.

  1. Connect

    Bring repair and fabrication data together

    Connect weld inspection and repair records with fabrication job data, fit-up QA checklists, joint specifications, welder assignments and station information.

  2. Understand

    Find relationships in your own history

    Analyze historical relationships between repair-rate changes and factors such as fit-up quality, joint type, accessibility, welder assignment and station.

  3. Detect

    Identify the likely root-cause category

    When a repair-rate change appears, rank likely cause categories according to their historical correlation with repair outcomes in that specific shop.

  4. Advise

    Show where to investigate

    Identify jobs, stations, fit-up practices or assignments most strongly associated with the elevated repair rate, giving the quality team a focused starting point for investigation.

  5. Verify

    Learn from the quality team's findings

    Compare flagged causes with the quality team's investigation results. Confirmed and rejected hypotheses become additional evidence for the shop-specific model.

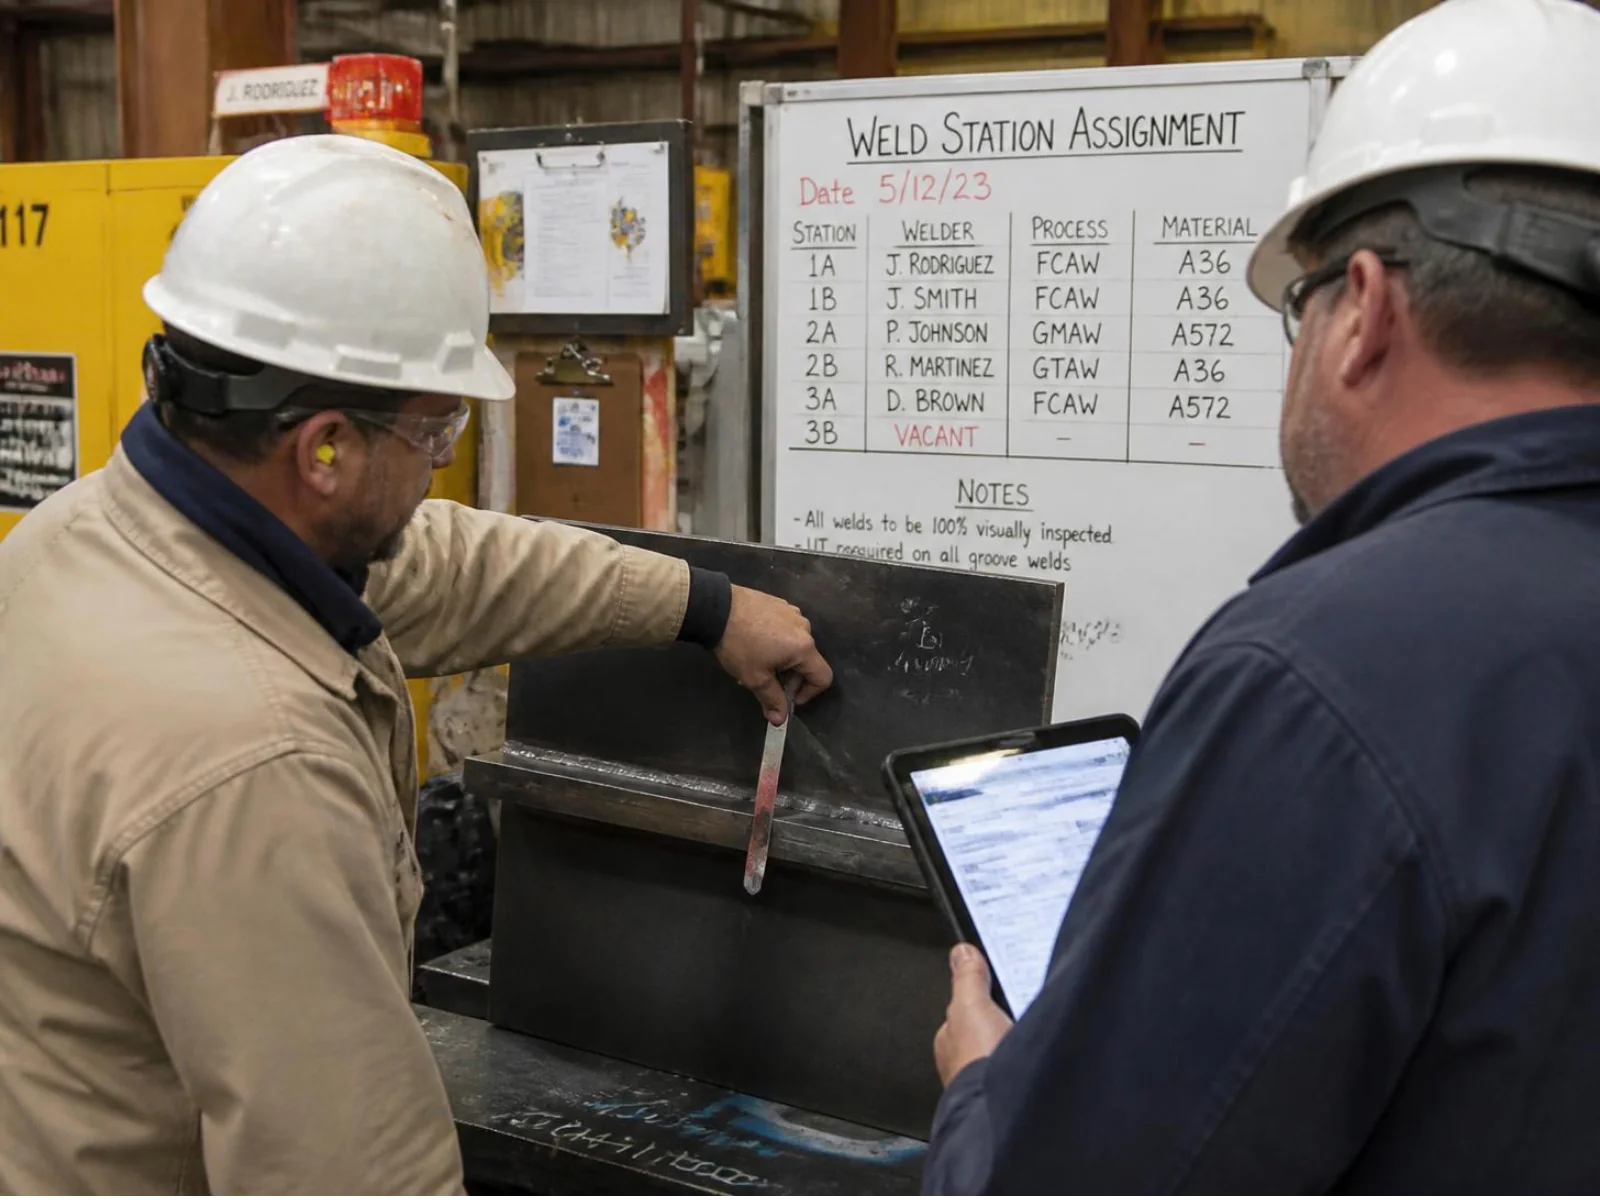
Weld inspection, repair, fit-up and fabrication data combined for root-cause analytics

Getting started

Start with one fabrication shopand the records you already keep.

For machinery fabrication quality teams that already hold inspection, repair and fit-up records. Delivered through OptiStudio as weld-repair root-cause analytics. Expert Services can help with data assessment and validation. Advisory only. No new inspection cameras or weld-control hardware.

  • What we need. Weld inspection and repair records, fit-up QA records, fabrication job data, joint information and welder or station assignments. Defect classification and quality-team findings help validation.
  • What you see first. A correlation view built from existing weld repair, inspection, fit-up and job-assignment records, tested against known historical repair trends before any live advisory cadence.
  • Where the limits are. Does not detect weld defects, replace inspection or NDT, change welding parameters or staffing, or replace quality engineers. Root-cause confidence improves as confirmed and rejected cases accumulate.
Explore OptiStudio

Questions weld quality teams ask us

Repair-rate changes are often investigated manually across disconnected systems. This use case connects repair and inspection records with fit-up, station and assignment data to rank likely causes for quality review.

No. It does not replace visual inspection, NDT or automated weld inspection. It analyzes the records those systems produce and connects them with upstream fabrication data.

Weld inspection and repair records, fit-up QA records, fabrication job data, joint information and welder or station assignments. No new inspection hardware.

No. It is advisory root-cause analytics. It does not automatically change fabrication processes, welding parameters or staffing.

No. Quality and fabrication teams review every flagged cause and determine what should be investigated or changed.

Through OptiStudio as quality analytics and decision support. Expert Services can support data assessment, integration and validation with your quality team.

The analysis depends on repair or inspection records that can be connected to time-aligned fit-up, job, station and assignment data. Root-cause confidence improves as more confirmed and rejected cases accumulate.

Machinery · Welded fabrication quality

Stop guessing which cause is driving your repair rate.

Connect your existing weld repair and inspection records to fit-up, station and job data and see whether the patterns in your own history can identify where repair-rate changes are coming from.