Upstream industry

Where the barrelpays for the miss

Wells already flow. Artificial lift and facilities decide how much reaches export. Deferment and flaring show up after the trip or constraint. The asset still has to deliver.

  • 01

    Per-well rates between the tests you already run

    Estimate oil, gas and water continuously from wellhead sensors, calibrated against your well tests, with uncertainty stated — not as fiscal measurement.

  • 02

    Limited lift gas allocated against current well response

    Model how each well responds to injection and allocate the gas you have while respecting compression, separator and handling constraints — with uncertainty shown before engineers change rates.

  • 03

    Methane inventory reconciled with the site measurement

    Compare source-level estimates with site-level campaigns, attribute the gap where evidence supports it, and keep uncertainty visible for verification — not as a Level 5 guarantee.

On the well and at the facility

The margin is decided between potential and export

Upstream assets lose barrels in three places that rarely share one screen: wells that trip or underperform before surveillance catches them, process and rotating equipment that defer production after the fact, and associated gas that is flared when takeaway or treating cannot keep up. Most of that is already in SCADA, well tests, historians and CMMS — after the fact.

Upstream wellsite and artificial lift operationsThe well

Artificial lift and well integrity decide whether potential is real

ESP, beam-pump and other lift failures repeatedly show up as a leading share of unplanned production deferment in published field studies. When solids, gas locking or trips reconcile late, the lost barrel is already gone — and the workover clock has started.
Upstream production facility monitoring and controlThe facility

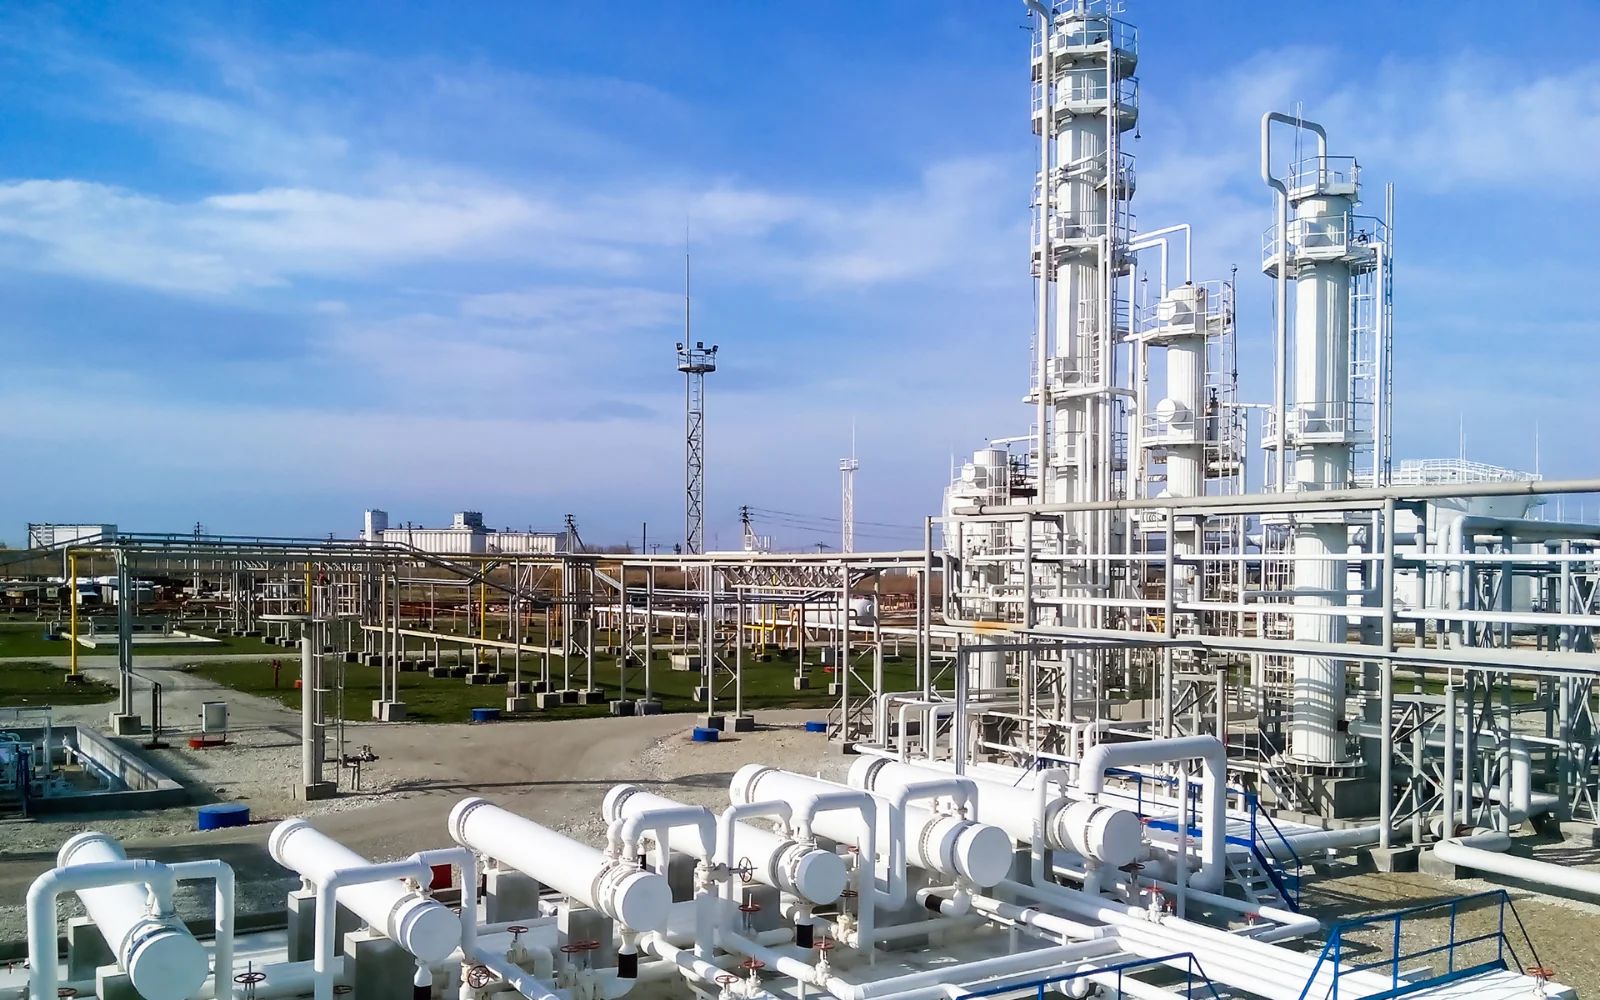
Separation, treating and compression sit on the critical path

Process upsets and rotating-equipment stops often rival wells as sources of unscheduled deferment. Conservative setpoints cover uncertainty in composition and load — and leave throughput, fuel gas and flare on the table.

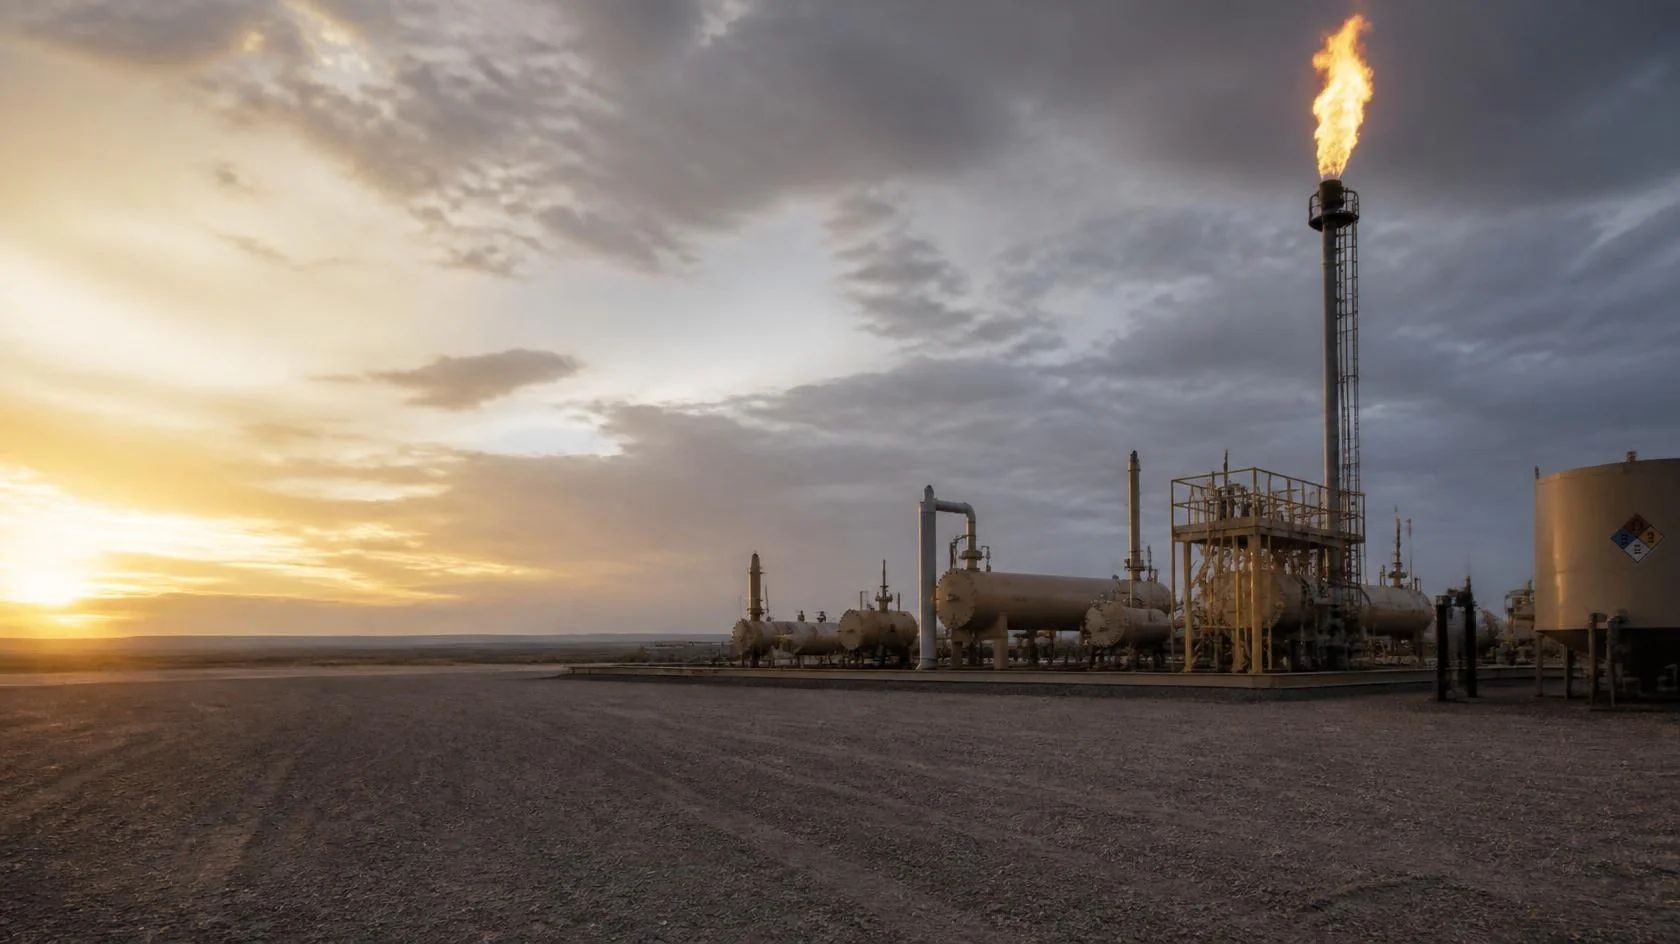
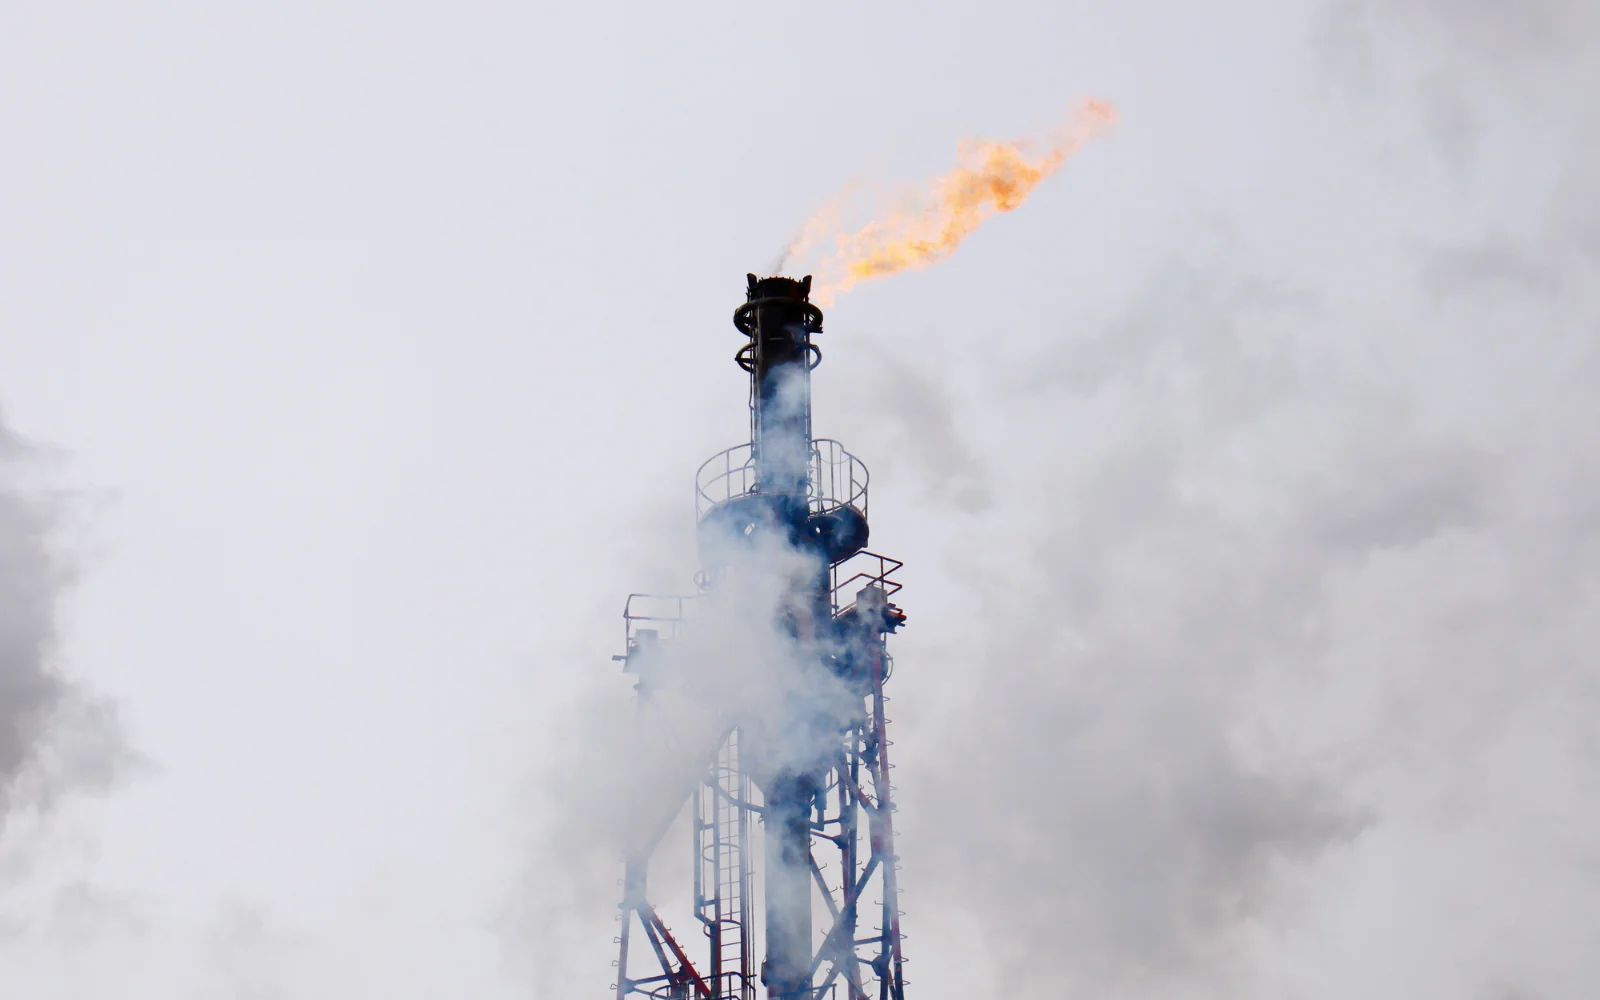
Associated gas and flare systems at upstream facilitiesAssociated gas

Flaring is still measured in tens of billions of cubic metres a year

World Bank satellite estimates put global gas flaring at upstream oil and gas facilities in the order of 150 bcm in recent years. Much of that is associated gas that could not be captured, treated or taken away when the system was constrained.

Restoring the well after the trip is the easy correction. It is also how the day is spent.

INSUS works from well and facility tags, well tests, work orders and equipment logs an asset already keeps. If the gap is an unread ESP alarm, a separator that never settled, or a clearance sheet that never joined the event, that is what we will say. Recommendations stay advisory. Existing DCS, SCADA and well controls stay in charge.

Explore the possibilities

Industry figures

The scale of what is being decided

Four external figures, each with its source. Nothing on this page is an estimate we made up. Where we cannot cite a number, we describe the situation in words instead.

Global flaring

151bcm

of gas flared at upstream oil and gas facilities (and LNG liquefaction) in 2024 per the World Bank Global Gas Flaring Tracker — up 3 bcm from 148 bcm in 2023, and the highest estimated volume since 2007.

Source: World Bank, 2025 Global Gas Flaring Tracker Report

Flaring intensity

5.1m³/bbl

global average flaring intensity in 2024 (cubic metres of gas flared per barrel of oil produced) in the same World Bank tracker — essentially unchanged in trend since about 2010, showing that higher oil output alone has not closed the flaring gap.

Source: World Bank Global Gas Flaring Tracker Report (July 2025 PDF)

Deferment drivers

33% / 31% / 25%

share of unplanned production deferment attributed to wells, process and rotating equipment respectively in a published SPE case study of a Malaysian upstream brownfield — illustrating how deferment often splits across wellstock and facilities, not a single asset class. Treat as that facility’s pattern, not an industry average.

Source: SPE-196255-MS, Improvement of Operational Excellence: Reducing Unplanned Production Deferment

Lift failures

28% → 18%

artificial-lift failure index reported for Petroleum Development Oman’s Field X cluster before and after a multi-year fail-less conversion programme (with subsurface unscheduled deferment falling from 3.7% to 2.1% of field potential). Site-specific results — not a promise for your asset.

Source: SPE-220818-MS, Field X Fail-Less Strategy (PDO artificial-lift performance case)

Upstream wells, separation and compression operations

Common problems

Problems that cost you before you notice

None of these show up as a single alarm. They show up in rates that are weeks old, the lift curve still used from the last study, and the methane inventory that does not match the site measurement.

  1. Per-well rates are known at test frequency, not every day

    Lift allocation, choke settings and water management depend on what each well is producing. Well tests are accurate but scarce, so optimisation often runs on figures that may be weeks old.

    See: Virtual Flow Metering Advisor
  2. Lift gas is still allocated from the last study

    Well response changes and facility limits move, but design-study curves can stay in use for months. Injection is then set cautiously when the expected production effect is uncertain.

    See: Gas Lift Allocation Advisor
  3. The methane inventory and the site measurement do not agree

    Source-level estimates and site-level campaigns are often handled in separate workflows. Discrepancies are recorded but may remain unexplained until verification forces the issue.

    See: OGMP 2.0 Level 5 Methane Reconciliation

Use cases

Places worth a closer look

Each is a specific starting point — this pad, this train — and a next conversation if it is worth your time.

Well schematic with choke pressure and temperature sensors and a continuous rate estimate between sparse well tests
Production measurement

Virtual Flow Metering Advisor

Estimate per-well oil, gas and water rates continuously from existing wellhead sensors, calibrated against your own well tests, with uncertainty stated. Not fiscal measurement.

See the full use case
Gas lift production response curves for multiple wells under a shared lift gas constraint
Artificial lift

Gas Lift Allocation Advisor

Allocate limited lift gas across wells using current well-response models, facility constraints and production data, with expected gains shown before injection changes. Advisory only.

See the full use case
Bottom-up methane inventory compared with top-down site measurement showing the reconciliation gap
Methane MRV

OGMP 2.0 Level 5 Methane Reconciliation

Reconcile source-level methane inventories with site-level measurements, explain the emissions gap and maintain evidence for OGMP 2.0 Level 5 reporting. Not a Level 5 guarantee.

See the full use case

FAQ

Questions that come up in every first call

A practical look at what INSUS needs, where it fits and what your team can expect.

The work that fits is the data an upstream asset already produces: well and facility SCADA tags, well tests, deferment codes, work orders, equipment condition signals and methane inventory and measurement records. Virtual flow metering, gas lift allocation and methane reconciliation can start from data you already hold. Closed-loop well control and automatic choke decisions are not promises we will make on day one.

Oil & Gas is the parent overview across upstream, midstream, processing and industrial operations. Upstream focuses on wells, artificial lift and production facilities. Midstream focuses on pipelines, compression and pump stations, throughput and integrity. Processing focuses on treating, NGL recovery, fractionation and conversion units. Industrial Operations covers shared plant utilities, permit-to-work and contractor coordination.

Usually not for SCADA, historians and maintenance. Most assets already have well and facility tags plus some work-order history. Virtual metering needs wellhead pressure and temperature instrumentation. Gas lift allocation needs reliable per-well injection measurement; header-only metering materially reduces value.

No. The person who knows this reservoir, this lift system and this facility stays responsible. The aim is to stop the next day repeating the same trip or process drift, and to flag a developing equipment issue before it defers production.

No. It advises the operations or engineering team. Existing well controllers, DCS and safety interlocks stay in charge of the loop. Protection systems are not touched.

No. Deferment and flaring depend on reservoir, facilities, takeaway, equipment condition and operating practice. We will not invent a deferment or flare-intensity target for your asset.

They are published global or site-specific figures — not measurements of your wells. Your SCADA, well tests and deferment records are the numbers that matter.

Yes. One pad, one separation train, or one compressor is usually the practical start. Measure that, then decide whether to widen.

Contact

Talk to an upstream expert

  • 30 minA focused conversation about the upstream problem you are trying to solve. No sales deck.
  • OutcomeA practical view of whether INSUS can help, what data would be needed and where it makes sense to start.
  • We will first understand your current process, what information you have and where the biggest gap is.
  • If the right answer is a sensor check, a procedure update, a maintenance action or an existing SCADA report, that is what we will tell you.

Request a call

We reply within one working day, from a person, with a proposed time.